When we build a fiscal microsimulation in Python, a naive single-ledger script can run cleanly and still return the wrong economic answer. That is true whether the first draft came from us, a legislative analyst, or an AI assistant. A clean run tells us only that the accounting identities executed, not that the model captures how claimants and employers behave.
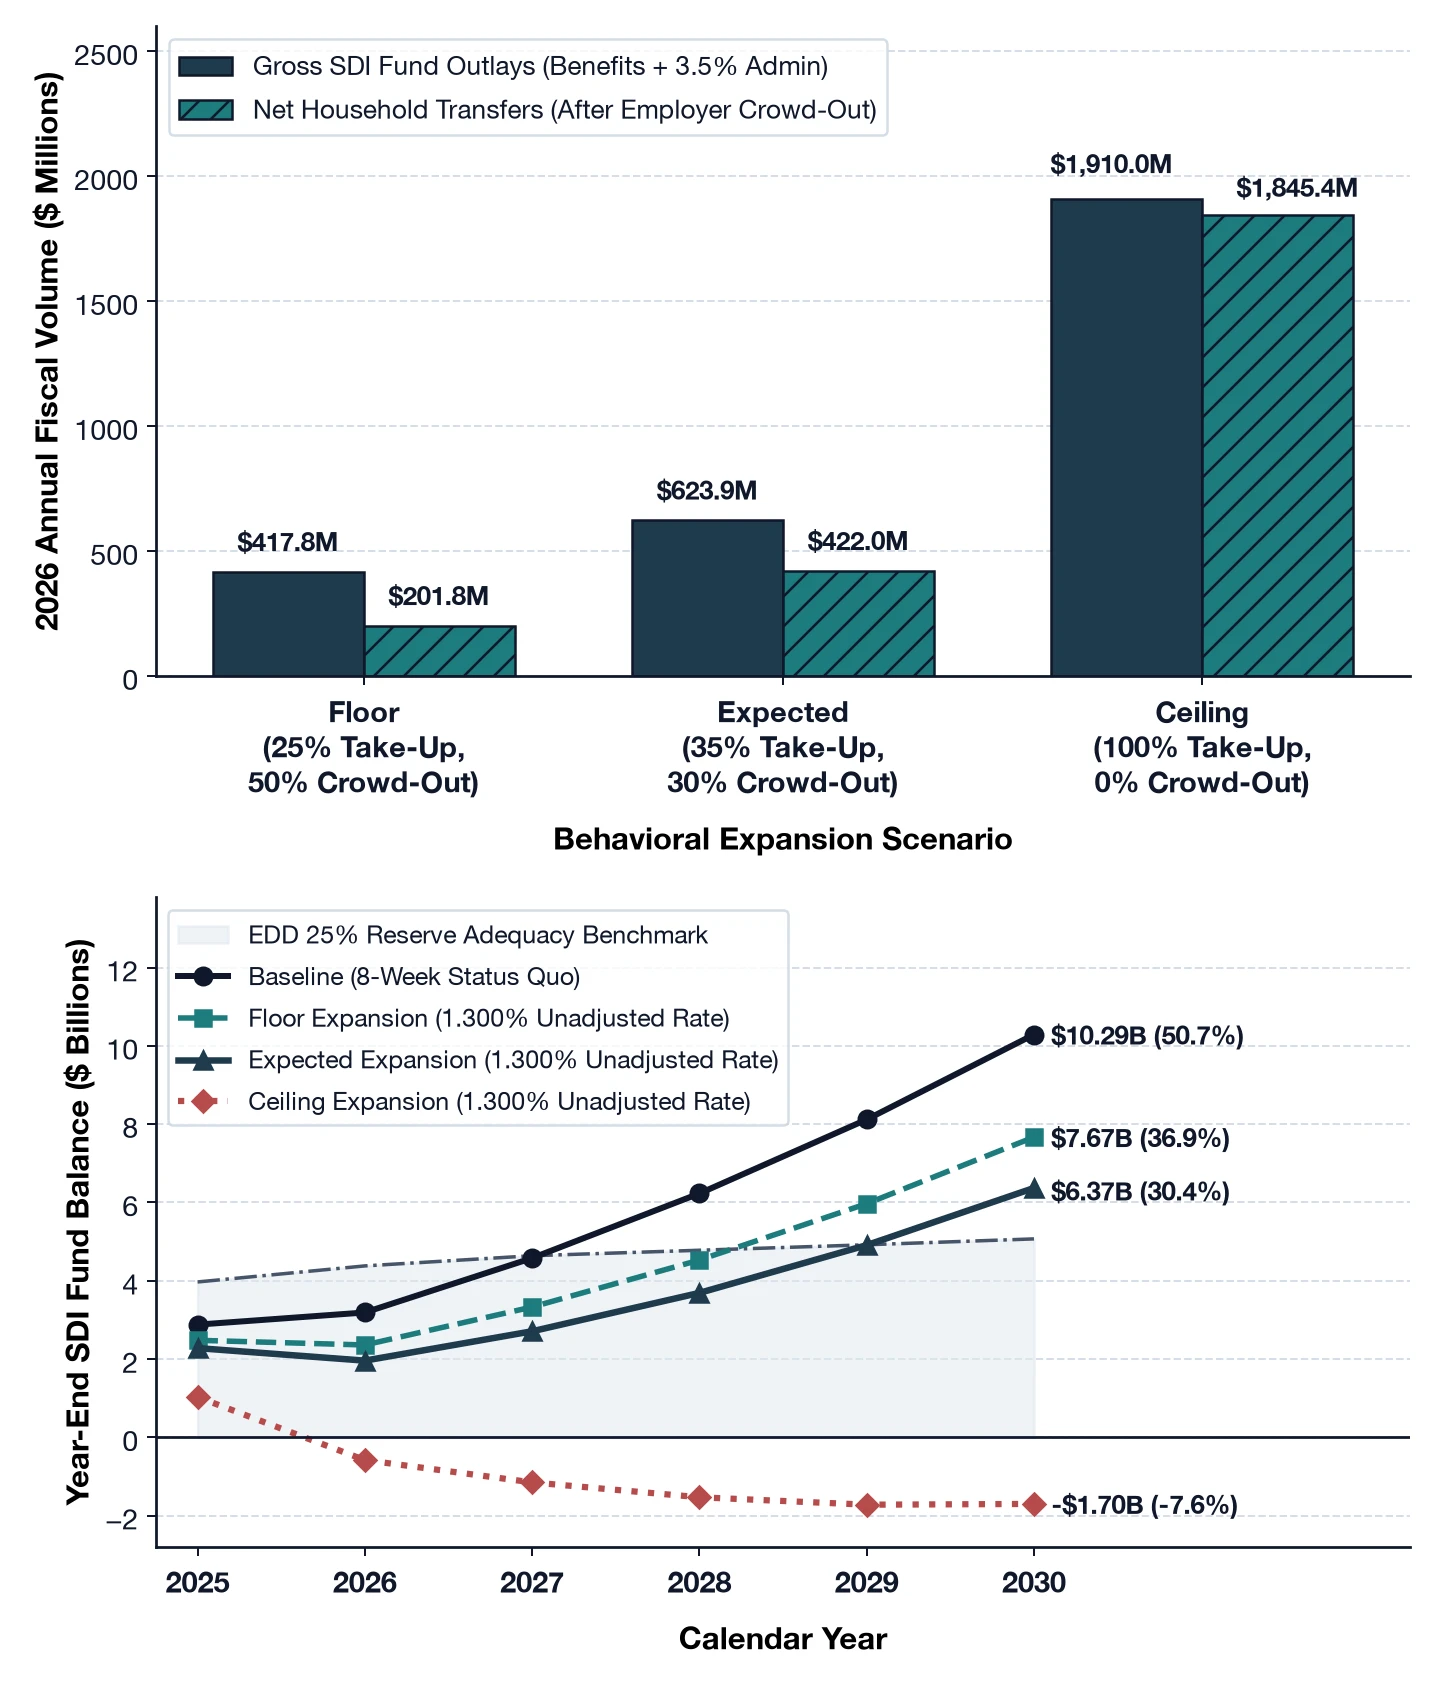
We can see both failure modes in a concrete policy testbed. Suppose California extends Paid Family Leave (PFL) duration from 8 weeks to 12 weeks across 18.5 million State Disability Insurance (SDI) covered workers.12 Those workers earn $1,371.5 billion in 2026 state-plan taxable wages under Senate Bill 951’s progressive 90% and 70% wage-replacement schedule. Against a static ceiling projection of 1,910.0 million dollars, our Expected behavioral scenario shows that gross 2026 SDI trust-fund outlays rise by 623.9 million dollars ($602.8M in statutory benefits plus $21.1M in 3.5% administration). At the same time, private employer benefit coordination offsets 30.0% ($180.8M) of those statutory benefits, leaving $422.0M in net household transfers.34
Microsimulation Design and Verification
We build a multi-year two-ledger simulation calibrated to the Employment Development Department (EDD) May 2026 Disability Insurance Fund Forecast.1 The baseline forecast projects 330,000 PFL claims in 2026, a $1,165.00 average weekly benefit amount, and $1,371.5 billion in state-plan taxable wages. We pair the fiscal model with an illustrative five-group wage incidence module anchored to 2023 American Community Survey (ACS) California earnings brackets.4 All simulation code, CSV exports, and verification checks live in our microsimulation repository.
Treating Statutory Ceilings as Full Extension Utilization
Why does a static ceiling score overstate Expected trust-fund outlays by a factor of 3.06 ($1,910.0M versus $623.9M in 2026), accumulating to $12.286B versus $4.013B from 2025 through 2030? The first specification trap sits in how legislative scoring models treat post-week-8 continuation.
If a scoring model prices all four added weeks for every claimant, it assumes no one returns to work between week 8 and week 12. In practice, many workers return earlier because job protection does not apply or because partial wage replacement cannot cover their rent. Under the California Family Rights Act (CFRA, Government Code Section 12945.2), employers with five or more workers guarantee 12 weeks of job-protected leave.2 Cash PFL benefits, however, stop at week 8 under Unemployment Insurance Code (UIC) Section 3300.1 In the EDD 2026 baseline forecast of 330,000 PFL first claims paid ($2.690B in baseline 8-week benefits), infant bonding represents 89.0% of volume (293,700 claims, averaging 7.2 weeks), alongside 10.0% for caregiving (5.8 weeks) and 1.0% for military exigency (4.5 weeks).1
Static ceiling scoring prices all four added weeks at 100% extension utilization and 20% new claim entry. That assumes every claimant stays out for all 12 weeks and pushes 2026 volume to 396,000 (+66,000 new claims). In empirical leave-taking records, continuation drops off after week 8.3 In our Expected scenario (35% extension utilization, or 1.4 added weeks per claimant, and 12% new claim entry, or 369,600 total claims), 2026 gross statutory benefits equal $602.8M. Adding $21.1M in 3.5% administrative overhead yields $623.9M in gross SDI outlays, as summarized in Table 1. Under our Floor scenario (25% extension utilization, 5% new claim entry, 346,500 total claims), 2026 gross SDI outlays equal $417.8M ($403.7M in benefits plus $14.1M in administration). Modeling post-week-8 continuation drop-off trims projected state disbursements by nearly two-thirds before payroll tax rates are set.
| Scenario & Behavioral Parameters | 2026 Claims (Total / Base & New) | 2026 Gross SDI Outlays ($M) | 2026 Employer Crowd-Out Offset ($M) | 2026 Net Household Transfers ($M) | Self-Financed SDI Rate & Display Revenue |
|---|---|---|---|---|---|
| Floor25.0% take-up, 5.0% extensive, 50.0% crowd-out | 346,500330,000 base / +16,500 new | $417.8M$403.7M benefits + $14.1M admin | $201.9M50.0% of gross benefits | $201.8M6-yr (2025–2030): $1.298B net / $2.688B gross | 1.33046% (+0.03046 pp)1.330% display ($411.4M; +$30.46/yr per $100k) |
| Expected35.0% take-up, 12.0% extensive, 30.0% crowd-out | 369,600330,000 base / +39,600 new | $623.9M$602.8M benefits + $21.1M admin | $180.8M30.0% of gross benefits | $422.0M6-yr (2025–2030): $2.714B net / $4.013B gross | 1.34549% (+0.04549 pp)1.345% display ($617.2M; +$45.49/yr per $100k) |
| Ceiling100.0% take-up, 20.0% extensive, 0.0% crowd-out | 396,000330,000 base / +66,000 new | $1,910.0M$1,845.4M benefits + $64.6M admin | $0.0M0.0% of gross benefits | $1,845.4M6-yr (2025–2030): $11.870B net / $12.286B gross | 1.43926% (+0.13926 pp)1.439% display ($1,906.4M; +$139.26/yr per $100k) |
The Parameter That Moves Household Welfare by $301.4M and the Budget by $0
Getting the public trust-fund outlay right ($623.9M under Expected behavior) solves only half the modeling problem. A standard single-ledger budget model assumes that every dollar paid out by the state trust fund increases household income by a dollar. Why does that assumption fail in paid leave?
In labor markets where medium and large employers offer paid parental leave, private plans operate under benefit-coordination rules (UIC Section 3303).24 If an employer already tops up leave pay to full salary, a longer state benefit simply replaces corporate payroll spending. When an employee takes leave, the state trust fund pays the statutory base benefit (70% or 90% of weekly wages up to the $1,765 weekly cap in 2026). The employer then pays only the top-off needed to reach 100% salary replacement.
Consider what happens during Weeks 9 through 12 for a salaried worker whose employer already guarantees 12 weeks of full pay. Under the 8-week statutory cap, state payments stop at the end of Week 8. The employer pays 100% of salary during Weeks 9 through 12 out of corporate payroll. Under the 12-week statutory cap, the state trust fund now pays benefits during Weeks 9 through 12. The worker still receives 100% of regular pay, so their net household income changes by zero dollars. Instead, the state check reimburses the employer’s private top-off liability dollar for dollar.
In our Expected scenario, 30.0% ($180.8M) of the state’s $602.8M in incremental statutory benefits substitutes for existing private employer wage continuation. That leaves $422.0M as true net household income gain. Under the Floor scenario (50.0% crowd-out), $201.9M of the $403.7M in statutory benefits flows into employer payroll relief, leaving $201.8M in net household transfers.
As Figure 1 shows, the post-2024 uncapped SDI wage base absorbs the Expected scenario expansion even without a rate hike above 1.300%. The year-end reserve dips to $1.96B (10.8% reserve ratio) in 2026 before rebuilding to $6.37B (30.4%) by 2030, exceeding the EDD 25% ($5.07B) adequacy benchmark. Under Ceiling utilization ($1,910.0M in 2026 outlays), the unadjusted fund becomes insolvent in 2026 (-$0.58B, -3.0%) and falls to -$1.70B (-7.6%) by 2030 (versus $10.29B under Baseline and $7.67B under Floor).
Checking the Implementation: The Two-Ledger Tornado Test
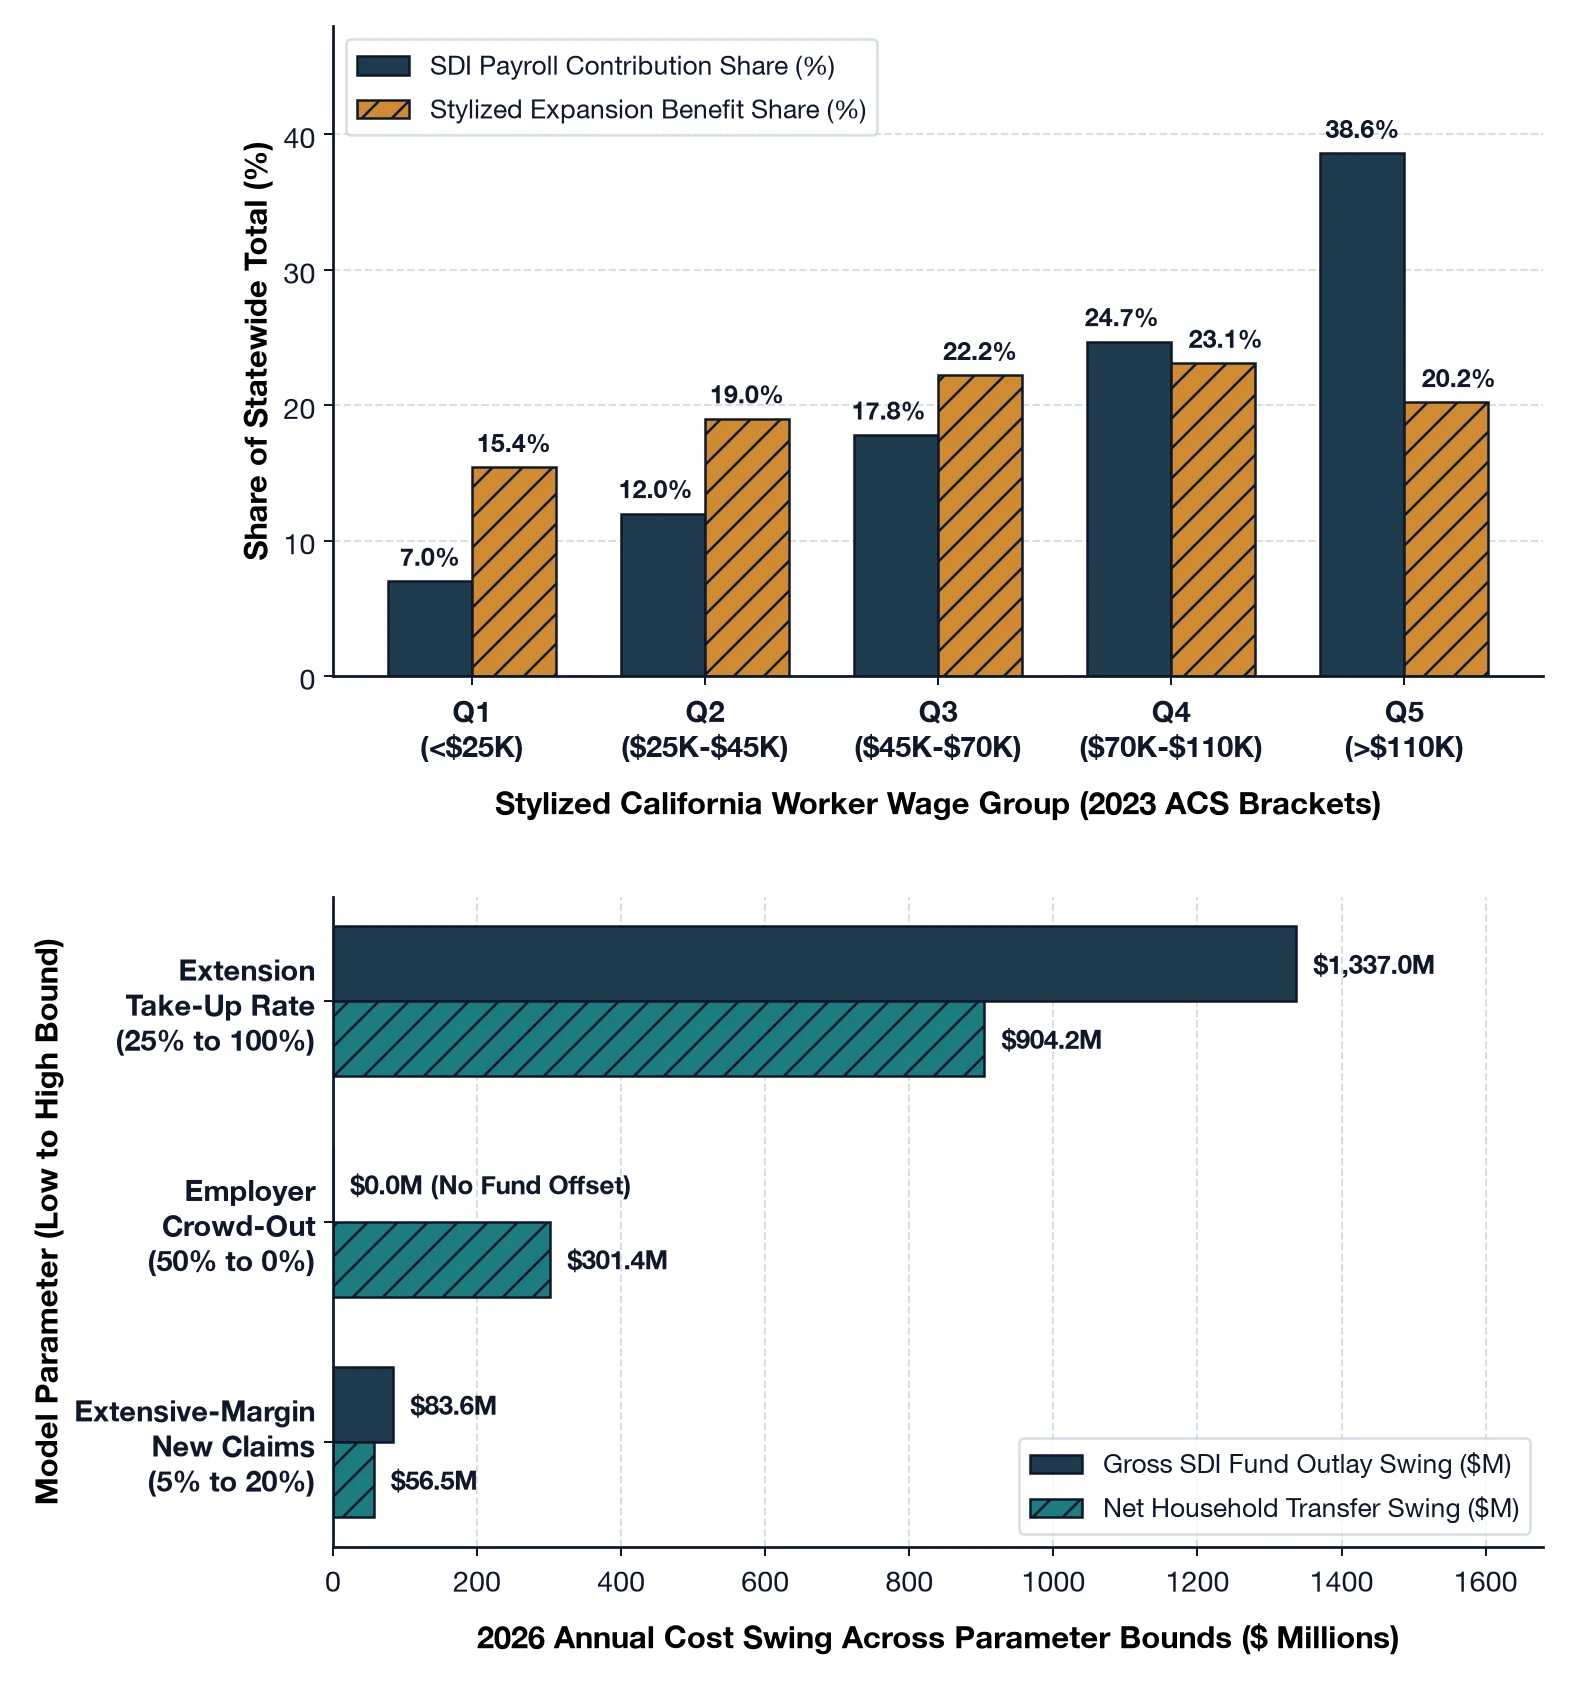
To see why a single-ledger model misses employer capture, we can vary one assumption at a time. If a parameter changes who keeps the money without changing how much the state writes in checks, a budget-only model will report zero sensitivity. Table 2 perturbs each behavioral input around the 2026 Expected benchmark ($623.9M gross outlays; $422.0M net transfers):
| Parameter Range | Low Bound | Expected Benchmark | High Bound | 2026 Gross Outlay Swing | 2026 Net Transfer Swing |
|---|---|---|---|---|---|
| Extension Take-Up Rate | 25%1.0 added wk | 35%1.4 added wks | 100%4.0 added wks | $445.7M to $1,782.6MRange: $1,337.0M (from $623.9M) | $301.4M to $1,205.6MRange: $904.2M (from $422.0M) |
| Employer Crowd-Out | 50%High top-off | 30%Expected top-off | 0%Zero offset | $623.9M to $623.9MFlat: $0.0M (at $623.9M) | $301.4M to $602.8MDifference: $301.4M (around $422.0M) |
| Extensive-Margin Claims | 5%+16,500 entrants | 12%+39,600 entrants | 20%+66,000 entrants | $584.9M to $668.5MSpread: $83.6M (around $623.9M) | $395.6M to $452.1MSpread: $56.5M (around $422.0M) |
Employer crowd-out between 50% and 0% leaves gross SDI outlays locked at $623.9M, producing a $0.0M budget swing. On the private ledger, however, family income gains swing by $301.4M ($301.4M to $602.8M). Meanwhile, shifting extension take-up from 25% to 100% moves public expenditure by $1,337.0M ($445.7M to $1,782.6M) and net household transfers by $904.2M ($301.4M to $1,205.6M), whereas shifting extensive-margin entry from 5% to 20% alters state disbursements by $83.6M ($584.9M to $668.5M) and worker cash flow by $56.5M ($395.6M to $452.1M). Without a separate household ledger, the employer crowd-out parameter registers zero variance and disappears from policy scoring.
Stylized Wage-Tier Incidence Under SB 951
A complete two-ledger model also tracks how the reform is financed across earnings brackets. After California Senate Bill 951 eliminated the $153,164 taxable wage ceiling in 2024 and raised wage replacement to 90% for low-wage workers in 2025, payroll taxes and benefit replacement follow opposite slopes across the income distribution.12
Self-financing the $623.9M Expected outlay across $1,371.5B in 2026 taxable payroll requires an exact increment of +0.04549 percentage points (a 1.34549% total rate, or +$45.49 per year per $100,000 of wages). On a three-decimal statutory schedule (1.345%, or +0.04500 percentage points), payroll collections raise $617.2M with $6.7M drawn from SDI reserves.
Without linking payroll tax brackets to benefit take-up, we cannot tell whether lifting the wage cap redistributes income to low-wage families. Individual EDD claim records linked to worker earnings are not public, so in Table 3 we pair five stylized wage groups anchored to 2023 ACS California brackets (under $25,000 in Q1 up to over $110,000 in Q5) with our fiscal ledger.4 The simulation combines stylized worker shares (25.0%, 22.0%, 20.0%, 18.0%, 15.0%) and group mean wages ($18,000 to $165,000; $64,190 statewide mean) with baseline claim shares (14.0% to 22.0%) and duration usage-boost multipliers (1.20 in Q1 down to 1.00 in Q5).
| Worker Earnings Bracket (2023 ACS) | Assumed Mean Wage & Worker Fraction | Payroll Contribution Share & Benefit Allocation | Added Tax (Exact / Display) | Gross Benefit Gain & Net Statutory Transfer (Gross Minus Tax) | Benefit Gain After 30% Crowd-Out (Before Tax) |
|---|---|---|---|---|---|
| Q1 (<$25,000) | $18,00025.0% workers / 90% SB 951 rate | 7.0% tax15.4% benefit (14.0% base × 1.20 boost) | $43.7M exact$43.3M at +0.045 pp display | $93.0M grossNet vs exact tax: +$49.3M | $65.1M |
| Q2 ($25,001–$45,000) | $35,00022.0% workers / 90% SB 951 rate | 12.0% tax19.0% benefit (18.0% base × 1.15 boost) | $74.8M exact$74.0M at +0.045 pp display | $114.6M grossNet vs exact tax: +$39.8M | $80.2M |
| Q3 ($45,001–$70,000) | $57,00020.0% workers / 90% SB 951 rate | 17.8% tax22.2% benefit (22.0% base × 1.10 boost) | $110.8M exact$109.6M at +0.045 pp display | $133.9M grossNet vs exact tax: +$23.1M | $93.8M |
| Q4 ($70,001–$110,000) | $88,00018.0% workers / 70% SB 951 rate | 24.7% tax23.1% benefit (24.0% base × 1.05 boost) | $154.0M exact$152.3M at +0.045 pp display | $139.5M grossNet vs exact tax: -$14.5M | $97.7M |
| Q5 (>$110,000) | $165,00015.0% workers / 70% capped ($1,765/wk) | 38.6% tax20.2% benefit (22.0% base × 1.00 boost) | $240.6M exact$238.0M at +0.045 pp display | $121.8M grossNet vs exact tax: -$118.8M | $85.2M |
| Statewide Total | $64,190100.0% workers / 70%–90% schedule | 100.0% tax100.0% benefit (progressivity +0.095) | $623.9M exact$617.2M at +0.045 pp display | $602.8M grossNet vs exact tax: -$21.1M (admin) | $422.0M |
In this illustrative scenario, lower-wage workers in Q1 and Q2 (earning up to $45,000) pay 19.0% of uncapped SDI taxes ($43.7M + $74.8M = $118.5M exact). They receive 34.4% of stylized expansion benefits ($93.0M + $114.6M = $207.6M gross). Before employer crowd-out, subtracting their $118.5M payroll tax from $207.6M in gross benefits yields +$89.1M in net statutory transfers (+$49.3M in Q1 and +$39.8M in Q2). Applying a uniform 30% employer crowd-out offset reduces their gross benefit gain to $145.3M ($65.1M in Q1 plus $80.2M in Q2). Subtracting the same $118.5M payroll tax from that $145.3M post-crowd-out benefit leaves +$26.8M in net household gain after tax and crowd-out, as illustrated in Figure 2. Top-group earners (Q5, at an assumed $165,000 mean wage) pay 38.6% of modeled payroll contributions ($240.6M exact) and receive 20.2% of modeled gross benefits ($121.8M gross; $85.2M before tax after 30% crowd-out), yielding a modeled net statutory cross-subsidy of -$118.8M and an illustrative progressivity index of +0.095. Under these assumed group shares and take-up multipliers, uncapping the payroll tax base keeps the illustrative schedule progressive on both ledgers.
A Portable Routine for Scoring Social Insurance Reforms
Four verification steps keep a social insurance simulation from conflating public cash flow with household welfare. First, model post-cap continuation decay across bounded behavioral scenarios (25% Floor, 35% Expected, 100% Ceiling) rather than pricing statutory duration increases at 100% ceiling utilization. Second, track multi-year trust-fund solvency against statutory reserve adequacy thresholds ($6.37B, or 30.4%, by 2030 under Expected behavior). Third, maintain separate public and private ledgers so employer top-off offsets ($180.8M under Expected behavior) are deducted from household welfare without reducing public fund disbursements. Fourth, run a dual-ledger tornado check to verify that private crowd-out parameters register zero variance on the budget ledger ($0.0M swing) and full variance on the household ledger ($301.4M swing).
Tools can draft the simulation loop in seconds. We remain responsible for whether the accounting structure captures both ledgers of the economy.
References and Endnotes
- California Employment Development Department (EDD). (2026). May 2026 Disability Insurance (DI) Fund Forecast and Paid Family Leave (PFL) Program Statistics. Sacramento, CA: EDD. ↩
- California Legislature. (2022). Senate Bill No. 951 (Durazo), Chapter 878, Statutes of 2022 (eliminating the taxable wage ceiling and establishing 90%/70% wage replacement in 2025), codified at Cal. Unemp. Ins. Code §§ 984, 2655, 3300–3303. ↩
- Rossin-Slater, M., Ruhm, C. J., & Waldfogel, J. (2013). The effects of California's Paid Family Leave program on mothers' leave-taking and subsequent labor market outcomes. Journal of Policy Analysis and Management, 32(2), 224–245. https://doi.org/10.1002/pam.21676; and Baum, C. L., & Ruhm, C. J. (2016). The effects of paid family leave in California on labor market outcomes. Journal of Policy Analysis and Management, 35(2), 333–366. https://doi.org/10.1002/pam.21894 ↩
- Goodman, J. M., Williams, C., & Dow, W. H. (2021). Racial/ethnic inequities in paid parental leave access. Health Equity, 5(1), 738–749. https://doi.org/10.1089/heq.2021.0001; and U.S. Census Bureau. (2024). 2023 American Community Survey (ACS) 1-Year Public Use Microdata Sample (PUMS), California Employed Civilian Labor Force. ↩
Cite this article
Cholette, V. (2026, October 26). Why Single-Ledger Fiscal Models Misprice Benefit Expansions. Too Early To Say. https://tooearlytosay.com/research/health-policy/pfl-expansion-gross-vs-net-incidence/