Medi-Cal pays a flat rate of $26.66 per half-hour for a one-on-one community health worker visit and $31.74 for health education.1 The state pays that exact same rate whether a worker walks two blocks in San Francisco or drives seventeen miles across San Bernardino County. On paper, a single statewide fee schedule looks fair. If the state sets one flat fee across all 58 counties, clinics in high-wage cities cannot cover local pay and clinics in rural counties lose their budget to unpaid drive time.
Why does one flat rate fall short in both places? To see how local wages and road networks interact, we can link all 9,039 California census tracts (9,036 populated land tracts across 58 counties, FIPS 06001 to 06115) with county wage, rent, transit, and hospital records.2,3 Under our baseline field model (330 annual field visits at $31.74, net of 67-cent IRS mileage), fee-for-service billing covers just 3.2% to 8.9% of a worker’s loaded pay. Across our full sensitivity grid, field cost recovery ranges from 0.0% to 8.4% under long-distance travel up to 7.7% to 9.9% under shorter trips with 26-cent vehicle operating costs. Even at zero travel, field billing covers only 8.3% to 11.0% of loaded pay. In a dense clinic with zero travel and back-to-back appointments (1,467 billable half-hour units per year), fee-for-service revenue peaks at 38.1% to 50.2% of annual worker cost.
Three-Tier Spatial Accounting & Scenario Design
Our pipeline separates three analytical tiers. Tier 1 (Observed Administrative & Spatial Inputs): statutory DHCS SPA 22-0001 fee rates ($26.66 individual; $31.74 U2 health education), 2024 BLS QCEW county wages, and 2024 HCAI Prevention Quality Indicator (PQI) adult discharges (279,905 PQI 90 stays across 31.01 million adults).1,2,4 Tier 1 also links 2023 Census TIGER/Line land area and ACS population across 9,039 tracts with 64,060 Cal-ITP GTFS transit stops.3 Tier 2 (Constructed County Cost Benchmarks): county loaded CHW compensation combines BLS QCEW and MIT Living Wage base tiers ($48,000 rural floor to $64,000 Bay Area base; $54,000 statewide) with salary-proportional fringe benefits, clinical supervision ($19,000 at the $54,000 statewide base), and 10% overhead (1.83912 times base salary), plus $4,406.20 in fixed training and equipment (within ±$1 component rounding for $48,000–$59,000 tiers; the $64,000 Bay Area tier uses the upstream benchmark’s $122,102, $8 below the schedule’s $122,110). County cost-of-living indices weight NAICS 62 healthcare wages (56%), HUD 2BR Fair Market Rents (30%), and all-industry wages (14%). Tier 3 (Parametric Scenarios): travel distance, speed, billable units, and acute-care offsets are modeled across explicit sensitivity scenarios in our spatial financing repository.
How the Statewide Vice Works
A flat fee schedule ignores two forces that pull clinic budgets apart from opposite ends of California. If we look only at the statewide average cost, we miss how urban pay floors and rural drive times each break the fee schedule on their own. In coastal cities, high wages and rents push the cost of hiring a full-time worker far above the state baseline. In rural counties, long road distances eat up the workday behind the windshield before a worker ever reaches a patient’s door.
We see the urban squeeze most clearly in San Francisco County (FIPS 06075), which ranks first statewide in living costs. San Francisco carries a composite cost index of 186.0, cutting the buying power of Medi-Cal’s flat rate to an effective index of 53.8. Hiring one full-time worker in San Francisco takes $122,102 in loaded annual pay ($64,000 base salary plus benefits, supervision, and overhead, compared with $103,719 statewide). Because 99.0% of San Francisco residents live near transit stops, field workers lose only 3.5% of their outreach hours to travel under baseline assumptions. Even so, capped fee-for-service billing brings in just $6,314 to $9,583 in net annual revenue. That covers 5.2% to 7.8% of the worker’s pay (8.2% under shorter travel; 8.3% at zero travel) and leaves a baseline gap of $112,519 per worker.
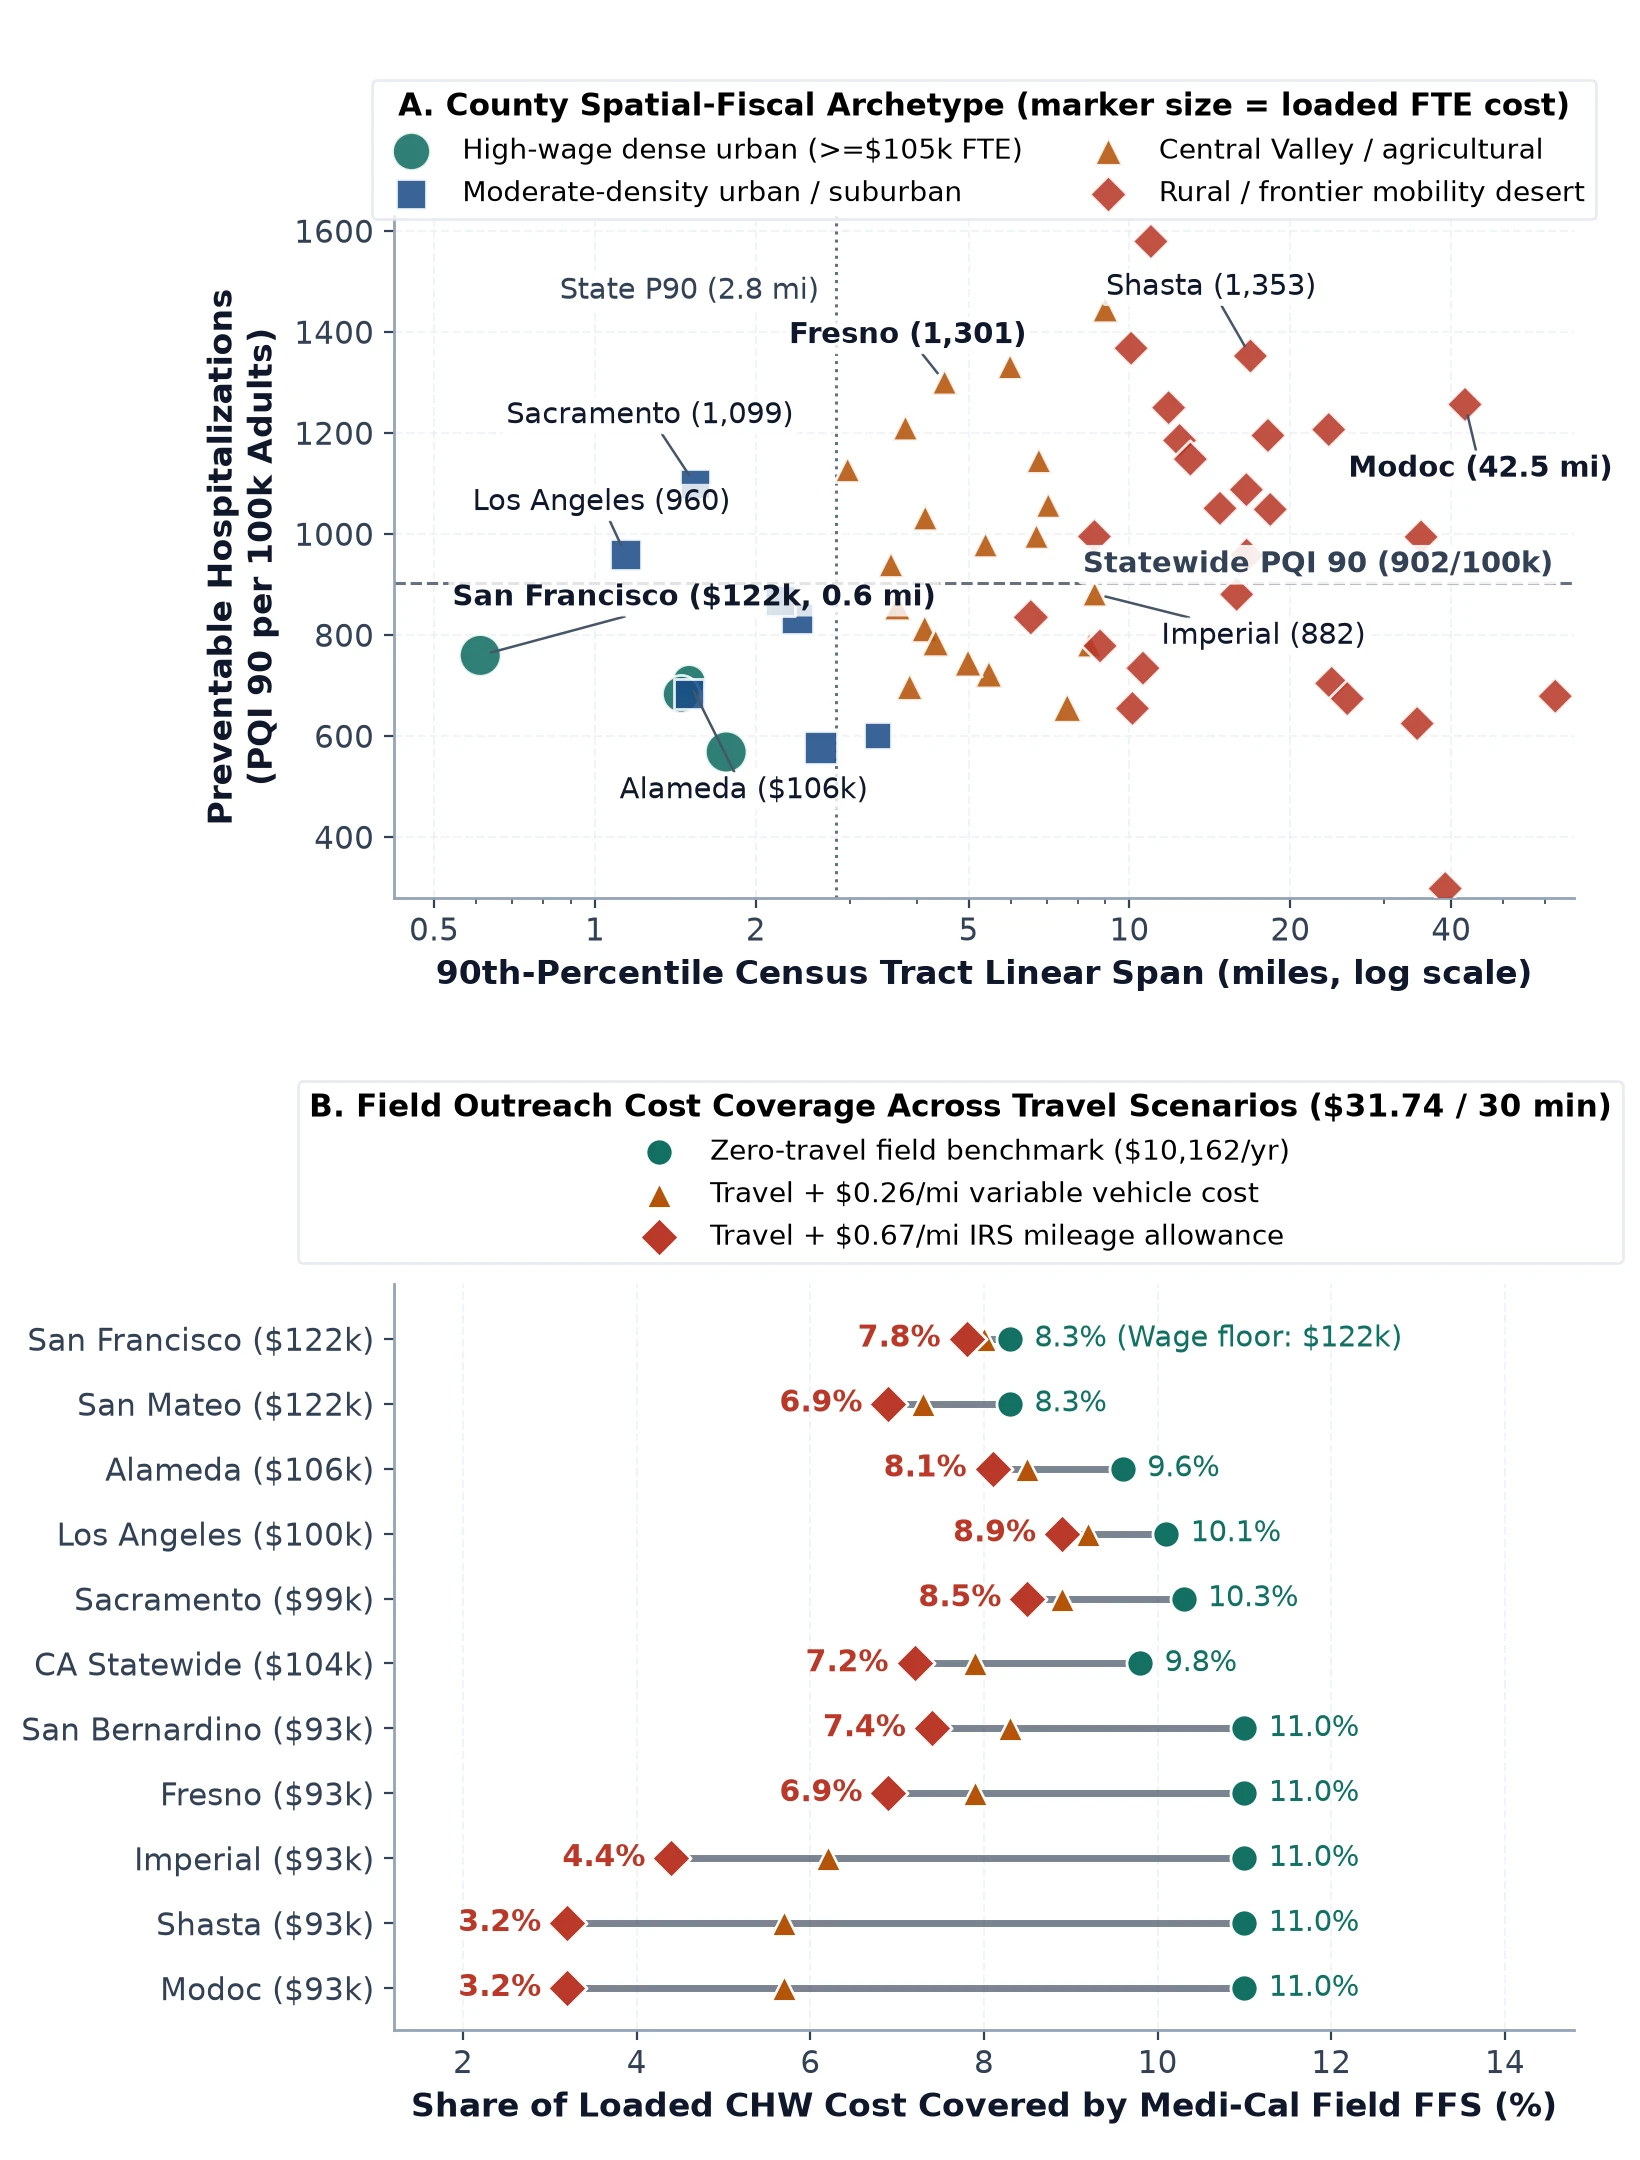
Now look at the rural end of the state. In rural and frontier counties such as Alpine (06003), Trinity (06105), Modoc (06049), Shasta (06089), and Imperial (06025), loaded pay sits at the rural floor of $92,684 per year ($48,000 base salary). Here, road distance replaces high wages as the main bottleneck. Under our baseline travel scenario, modeled round-trip visits average 17.5 miles in Alpine, Trinity, Modoc, and Shasta Counties (and 12.2 miles in Imperial County). Driving takes up a modeled 33.0% of field outreach hours. Subtracting the 67-cent IRS standard mileage rate ($2,692 to $3,869 per year) cuts modeled net revenue to $670 to $2,939 in the frontier north (and $1,847 to $4,116 in Imperial).5 That covers just 0.7% to 3.2% of constructed worker pay in the northern frontier and 2.0% to 4.4% in Imperial. Under shorter travel and 26-cent vehicle operating costs, modeled rural coverage rises to 7.7% to 8.3% ($7,091 to $7,711). Under unchained 360-visit high-dispersion travel, mileage costs wipe out gross billing (0.0% net coverage), as shown in Figure 1. Without a wage adjustment in cities and a mileage add-on in rural counties, Medi-Cal’s flat fee leaves over 90% of modeled field outreach costs unpaid across California.
County Averages Hide Tract-Level Mobility Deserts
Even a 58-county table hides large gaps inside individual counties. Many California counties hold both dense city blocks and remote rural or desert mobility deserts within a single county line. If the state adjusts pay rates only by county average, a clinic serving remote desert tracts inside San Bernardino still gets paid as if its workers were walking two blocks in the city center.
To see which counties have the widest internal split, we can compare census-tract sprawl across all 9,039 California tracts. Santa Barbara County (06083) tops the statewide index with a sprawl standard deviation of 2,707.1 across 102 populated land tracts and a 375.7-fold density ratio between its 90th and 10th percentile tracts. Among major urban counties with over one million residents, San Bernardino County (06071) leads in internal spread, posting a score of 169.5 across 464 populated tracts home to 2.18 million residents.
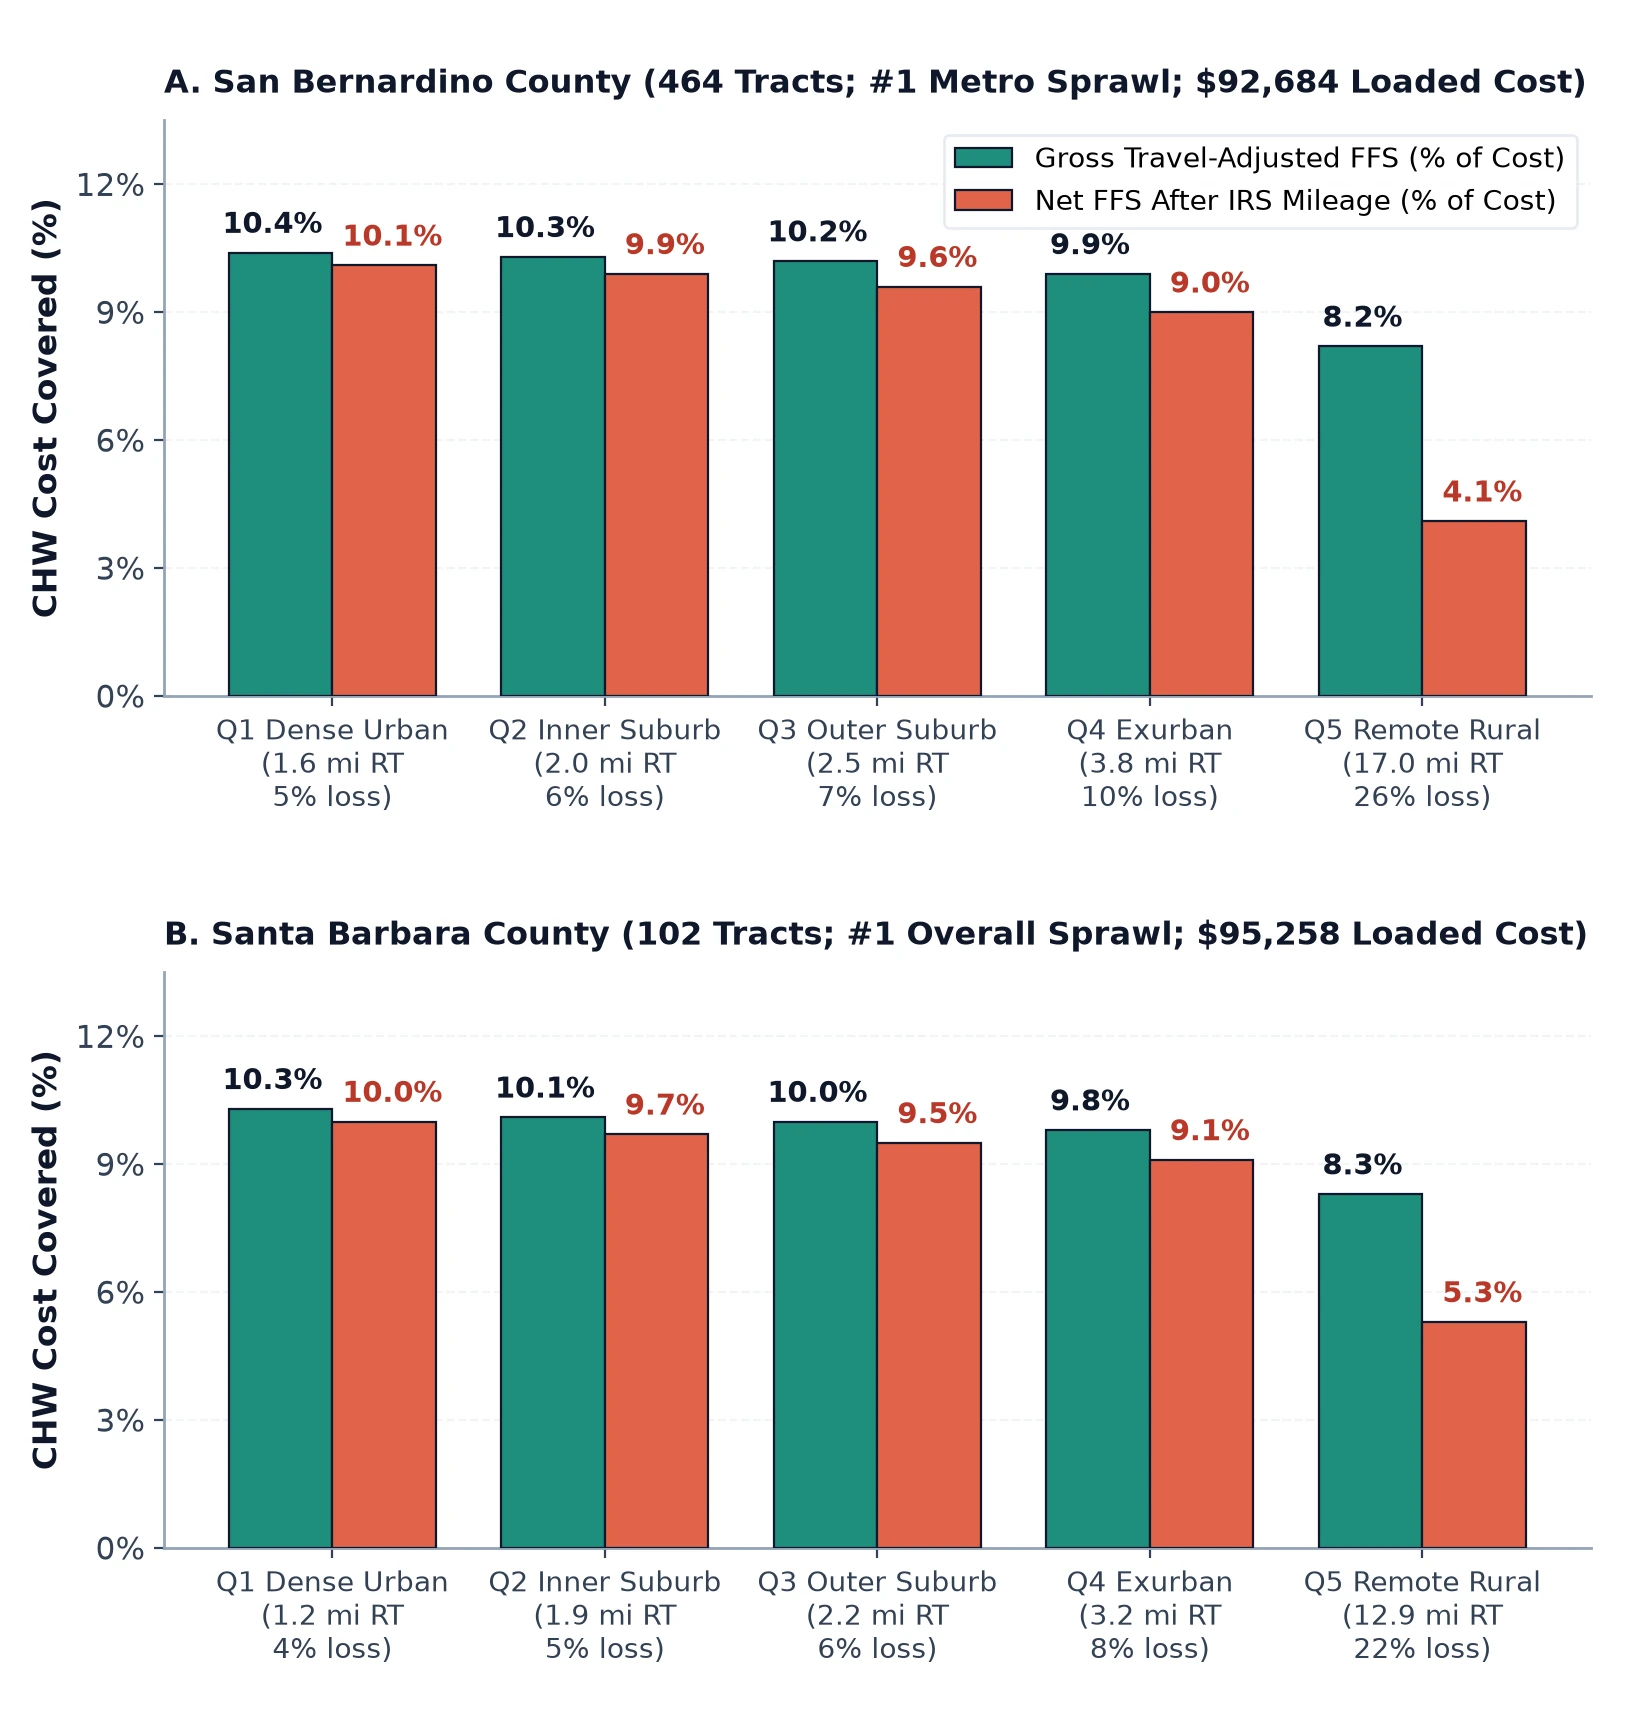
To see what county averages miss, we can group populated tracts in both counties into five density quintiles (Q1 to Q5). Quintile 1 holds the densest urban core, while Quintile 5 holds the most remote desert and mountain tracts, as shown in Table 1 and Figure 2.
| County & Tract Density Quintile | Modeled Round-Trip (mi) | Modeled Travel Loss (%) | Modeled FFS Revenue (Gross → Net IRS) | Modeled Net Coverage (IRS / Var) |
|---|---|---|---|---|
| San Bernardino Q1 (Dense Urban Core)93 tracts · 476,712 pop · 9,289.1/sq mi · 0.0% no-transit | 1.6 mi | 4.7% | $9,679 → $9,327 | 10.1%10.3% at $0.26/mi |
| San Bernardino Q2 (Inner Suburban)93 tracts · 468,215 pop · 6,551.2/sq mi · 0.0% no-transit | 2.0 mi | 5.7% | $9,582 → $9,141 | 9.9%10.2% at $0.26/mi |
| San Bernardino Q3 (Outer Suburban)92 tracts · 457,595 pop · 4,250.6/sq mi · 0.0% no-transit | 2.5 mi | 6.8% | $9,468 → $8,919 | 9.6%10.0% at $0.26/mi |
| San Bernardino Q4 (Exurban / Foothill)93 tracts · 438,901 pop · 1,817.4/sq mi · 96.9% no-transit | 3.8 mi | 9.5% | $9,200 → $8,366 | 9.0%9.6% at $0.26/mi |
| San Bernardino Q5 (Remote Desert / Rural)93 tracts · 342,474 pop · 228.1/sq mi · 100.0% no-transit | 17.0 mi | 25.6% | $7,556 → $3,813 | 4.1%6.6% at $0.26/mi |
| Santa Barbara Q1 (Dense Urban Core)21 tracts · 95,876 pop · 14,352.1/sq mi · 0.0% no-transit | 1.2 mi | 3.8% | $9,779 → $9,510 | 10.0%10.2% at $0.26/mi |
| Santa Barbara Q3 (Outer Suburban)20 tracts · 85,305 pop · 4,382.5/sq mi · 0.0% no-transit | 2.2 mi | 6.2% | $9,527 → $9,036 | 9.5%9.8% at $0.26/mi |
| Santa Barbara Q5 (Remote Desert / Rural)21 tracts · 77,845 pop · 214.3/sq mi · 100.0% no-transit | 12.9 mi | 21.9% | $7,936 → $5,094 | 5.3%7.2% at $0.26/mi |
Inside San Bernardino County, loaded annual pay sits at $92,684 per worker. In Quintile 1 urban tracts (9,289.1 residents per square mile), round-trip visits average 1.6 miles and drive time takes 4.7% of field hours. Net fee-for-service revenue covers 10.1% of worker pay ($9,327 after 67-cent IRS mileage, or 10.3% at 26-cent vehicle operating cost). In Quintile 5 desert tracts (228.1 residents per square mile and 100.0% without transit service), round-trip distance jumps more than ten-fold to 17.0 miles (36.3 minutes per visit). Unpaid travel takes 25.6% of work hours and $3,743 in annual IRS mileage costs. That cuts net revenue to $3,813 (4.1% of worker cost, or 6.6% at variable vehicle cost) and leaves an annual gap of $88,871 per worker.
The same pattern holds inside Santa Barbara County, where loaded annual pay is $95,258. Moving from dense Quintile 1 coastal tracts (14,352.1 residents per square mile) to remote Quintile 5 ranch tracts (214.3 residents per square mile) raises round-trip travel from 1.2 miles to 12.9 miles. Unpaid drive time jumps from 3.8% to 21.9%, while net fee-for-service pay falls from 10.0% ($9,510) to 5.3% ($5,094) under IRS mileage (10.2% to 7.2% under variable vehicle cost). Because remote tracts lose over a fifth of the workday to driving while urban tracts in the same county lose under 5%, county-average rate adjustments still leave rural outreach routes underfunded.
Do Avoided Hospitalizations Offset the Deficit?
If fee-for-service billing cannot cover a community health worker’s pay, why do managed care plans fund them? The answer sits on the hospital ledger, but only when plans enroll high-risk patients. In a multi-center randomized trial of 592 low-income primary care patients with multiple chronic conditions, the IMPaCT community health worker program cut repeat hospital stays by 30% (p = 0.02) and lowered 30-day readmissions.6 A pooled Medicaid return-on-investment study of the IMPaCT trials found $1,472 per patient in annual Medicaid acute-care savings against a $596 program cost, returning $2.47 per $1 spent.7
Can we apply those clinical-trial savings across every neighborhood caseload? No. If a health plan budgets assuming every neighborhood patient is hospitalized as often as a recently discharged clinical-trial patient, it will project nearly ten times more avoided hospital stays than actually occur. And if a plan applies one state average offset to every county, it will overstate savings in healthier counties and understate them in high-burden ones.
To keep savings estimates honest, we can compare two caseload baselines anchored to 2024 county Prevention Quality Indicator (PQI) hospital rates. We value avoided care at Medi-Cal benchmarks of $7,000 per inpatient stay, $6,000 per readmission, and $600 per emergency visit (Table 2):4,8
- General Neighborhood Outreach Caseload (150 Adults Scaled to Observed County PQI 92 Chronic Rates): Across California (715.3 chronic PQI stays per 100,000 adults), a general neighborhood panel of 150 adults prevents a modeled 6.6 emergency visits and 1.10 inpatient stays in Year 1. That yields $10,600 in direct Medi-Cal hospital savings ($34,900 at all-payer hospital costs). Across all 58 counties, Year-1 Medi-Cal offsets scale with local chronic PQI rates from $3,000 in Mono County and $6,400 in Marin County (434.4 PQI 92) to $9,200 in Imperial County (618.8 PQI 92) and $19,200 in Butte County (1,297.1 PQI 92). Because general outreach prevents future illness rather than immediate readmissions, Year-1 Medi-Cal bed savings cover only 3.2% to 20.7% of worker pay. They never close the fee-for-service gap on their own.
- High-Risk Post-Discharge Cohort Caseload (55 Chronically Ill Patients Indexed to County PQI 90 Rates): Suppose we focus a worker’s panel on 55 chronically ill post-discharge patients who match the IMPaCT trial criteria.6,7 At the statewide mean PQI 90 rate (902.5 per 100,000), that high-risk cohort yields $107,006 in modeled Year-1 Medi-Cal savings ($291,171 at all-payer costs). When we index that trial benchmark to each county’s observed HCAI PQI 90 rate, modeled high-risk Medi-Cal savings vary five-fold across California. They range from $35,380 in Mono County and $67,440 in San Mateo County (59.3% of the $113,658 baseline gap) to $90,110 in San Francisco (80.1% of the $112,519 gap). In high-burden counties, PQI-indexed savings reach $133,743 in San Bernardino (155.9% of the $85,811 gap) and $187,287 in Butte County (211.1% of the $88,719 gap). Under county PQI-90 indexing, high-risk hospital savings exceed the baseline funding gap in 40 of 58 counties. Meanwhile, high-wage or lower-PQI counties (San Francisco, San Mateo, Marin, Alameda, Santa Barbara, Trinity) still need blended monthly capitation or grant support.
In our PQI-indexed scenario model, avoided hospital stays can offset a field worker’s cost, but only when plans enroll high-risk patients after discharge. In counties with high preventable admission rates, modeled acute-care offsets exceed the baseline funding gap. If a clinic runs general neighborhood outreach—or operates in a high-wage county with lower admission rates—modeled bed savings alone do not close the budget gap.
| County & Spatial-Fiscal Archetype (FIPS) | Constructed Loaded Cost | Modeled Baseline Travel & Loss | Modeled Coverage (Base / Cons / Clinic) | PQI-Indexed Offset (Gen 150 / High-Risk 55) & Break-Even PMPM |
|---|---|---|---|---|
| San Francisco (06075)High-Wage Dense Urban (#1 Cost Index: 186.0) | $122,102 | 1.02 mi3.5% loss | 7.8% ($9,583)8.2% cons · 38.1% clinic | $9,300 gen / $90,110 HR80.1% of gap · $170.48/mo |
| San Mateo (06081)High-Wage Dense Urban (Cost Index: 181.1) | $122,102 | 3.09 mi10.2% loss | 6.9% ($8,444)7.9% cons · 38.1% clinic | $6,700 gen / $67,440 HR59.3% of gap · $172.21/mo |
| Alameda (06001)High-Wage Dense Urban (Cost Index: 162.1) | $105,926 | 2.80 mi9.3% loss | 8.1% ($8,603)9.1% cons · 44.0% clinic | $8,600 gen / $83,969 HR86.3% of gap · $147.46/mo |
| Santa Barbara (06083)Moderate-Density Urban / Suburban (#1 Spread · Index: 140.8) | $95,258 | 5.51 mi17.5% loss | 7.5% ($7,170)9.6% cons · 48.9% clinic | $6,700 gen / $71,329 HR81.0% of gap · $133.47/mo |
| Los Angeles (06037)Moderate-Density Urban / Suburban (Cost Index: 146.1) | $100,408 | 2.10 mi7.0% loss | 8.9% ($8,985)9.7% cons · 46.4% clinic | $11,400 gen / $113,800 HR124.5% of gap · $138.52/mo |
| San Bernardino (06071)Agri-Rural / Central Valley Dispersed (#1 Metro Spread · Index: 111.7) | $92,684 | 6.02 mi19.3% loss | 7.4% ($6,873)9.8% cons · 50.2% clinic | $13,400 gen / $133,743 HR155.9% of gap · $130.02/mo |
| Fresno (06019)Agri-Rural / Central Valley Dispersed (Cost Index: 96.1) | $92,684 | 7.09 mi21.9% loss | 6.9% ($6,368)9.6% cons · 50.2% clinic | $15,200 gen / $154,302 HR178.8% of gap · $130.78/mo |
| Imperial (06025)Agri-Rural / Central Valley Dispersed (Cost Index: 83.7) | $92,684 | 12.18 mi33.0% loss | 4.4% ($4,116)8.8% cons · 50.2% clinic | $9,200 gen / $104,575 HR118.1% of gap · $134.19/mo |
| Trinity (06105)High-Dispersion Rural / Frontier (Cost Index: 79.6) | $92,684 | 17.50 mi33.0% loss | 3.2% ($2,939)8.3% cons · 50.2% clinic | $5,500 gen / $74,116 HR82.6% of gap · $135.98/mo |
| Alpine (06003)High-Dispersion Rural / Frontier (Cost Index: 99.3) | $92,684 | 17.50 mi33.0% loss | 3.2% ($2,939)8.3% cons · 50.2% clinic | $10,600 gen / $107,006 HR119.2% of gap · $135.98/mo |
What It Takes to Make the Numbers Work
The split between clinic budgets and health plan budgets explains why community health worker hiring has stalled on the ground. Community groups and clinics pay 100% of local wages and mileage upfront, while managed care plans keep 100% of any hospital savings.9 If plans keep paying clinics by the half-hour visit while keeping the hospital savings, clinics cannot afford to keep field workers on the road.
To close that budget split, there are a few reasonable responses for Medi-Cal purchasers and plans. First, plans can replace half-hour billing with a monthly payment of $129.87 to $172.21 per member per month for a 55-patient high-risk panel ($47.62 to $63.14 for a 150-patient panel). Under baseline travel, that monthly rate covers full worker pay and breaks even once each worker prevents 12.2 to 16.2 Medicaid hospital stays per year (or 4.6 to 6.1 stays at all-payer hospital costs). Second, the state can index fee schedules to county wages and add tract-level mileage payments so rural clinics are not penalized for home visits. Third, plans can pair monthly payments with upfront CalAIM PATH grants so community groups can hire staff before hospital savings arrive.9
References and Endnotes
- California Department of Health Care Services (DHCS). (2022). Medi-Cal State Plan Amendment (SPA) 22-0001 and Community Health Worker (CHW) Services Provider Manual: CPT Codes 98960, 98961, and 98962 ($26.66 per 30-minute individual unit; $31.74 per 30-minute health education unit with modifier U2); Sacramento, CA: DHCS ↩
- US Bureau of Labor Statistics (BLS). (2024). Quarterly Census of Employment and Wages (QCEW) and Occupational Employment and Wage Statistics (OEWS): California County All-Industry and NAICS 62 Healthcare Wages; and Centers for Medicare & Medicaid Services (CMS). (2025). Medicare Physician Fee Schedule Practice Expense Geographic Practice Cost Index (GPCI) Cost-Share Weights ↩
- US Census Bureau. (2024). American Community Survey (ACS) 5-Year Estimates (2019–2023) and 2023 TIGER/Line Shapefiles, California Tracts (9,039 Tracts, FIPS 06001–06115); and California Integrated Travel Project (Cal-ITP). (2023). General Transit Feed Specification (GTFS) Statewide Transit Stop Inventory (64,060 Stops) ↩
- California Department of Health Care Access and Information (HCAI). (2024). Prevention Quality Indicators (PQI) for California Counties: Adult Hospital Discharges for Ambulatory Care Sensitive Conditions (PQI 90 Overall Composite: 279,905 discharges, 902.5 per 100,000; PQI 92 Chronic Composite: 221,844 discharges, 715.3 per 100,000) ↩
- Internal Revenue Service (IRS). (2024). Notice 2024-08: 2024 Standard Mileage Rates ($0.67 per mile business rate, compared against $0.26 per mile variable operating cost) ↩
- Kangovi, S., Mitra, N., Norton, L., Harte, R., Zhao, X., Carter, T., Grande, D., & Long, J. A. (2018). Effect of community health worker support on clinical outcomes of low-income patients across primary care facilities: A randomized clinical trial. JAMA Internal Medicine, 178(12), 1635–1643. https://doi.org/10.1001/jamainternmed.2018.4630 ↩
- Kangovi, S., Mitra, N., Grande, D., Long, J. A., & Asch, D. A. (2020). Evidence-based community health worker program addresses unmet social needs and generates positive return on investment. Health Affairs, 39(2), 207–213. https://doi.org/10.1377/hlthaff.2019.00981 ↩
- Agency for Healthcare Research and Quality (AHRQ). (2023). Healthcare Cost and Utilization Project (HCUP) Statistical Brief: Costs of Hospital Stays and Emergency Department Visits for Medicaid Adults; Rockville, MD: AHRQ ↩
- California Department of Health Care Services (DHCS). (2024). CalAIM Enhanced Care Management (ECM), Community Supports, and Providing Access and Transforming Health (PATH) Technical Assistance Guide; Sacramento, CA: DHCS ↩
Cite this article
Cholette, V. (2026, October 26). Why Flat Medi-Cal Rates Underfund Community Health Care. Too Early To Say. https://tooearlytosay.com/research/health-policy/chw-spatial-financing-medi-cal/