Suppose we want to know whether shifting Medicaid enrollees into private managed care plans raises public fraud enforcement output. Over the past two decades, states have moved primary Medicaid delivery from fee-for-service payment to capitated managed care organizations (MCOs). By 2024, comprehensive risk-based plans enrolled roughly three-quarters of Medicaid enrollees nationwide and received more than half of program benefit spending.1, 2 Because capitated plans receive a fixed monthly payment per enrollee and bear financial risk for medical claims, a prominent policy argument holds that private plan incentives naturally curb provider fraud and boost public enforcement output.3
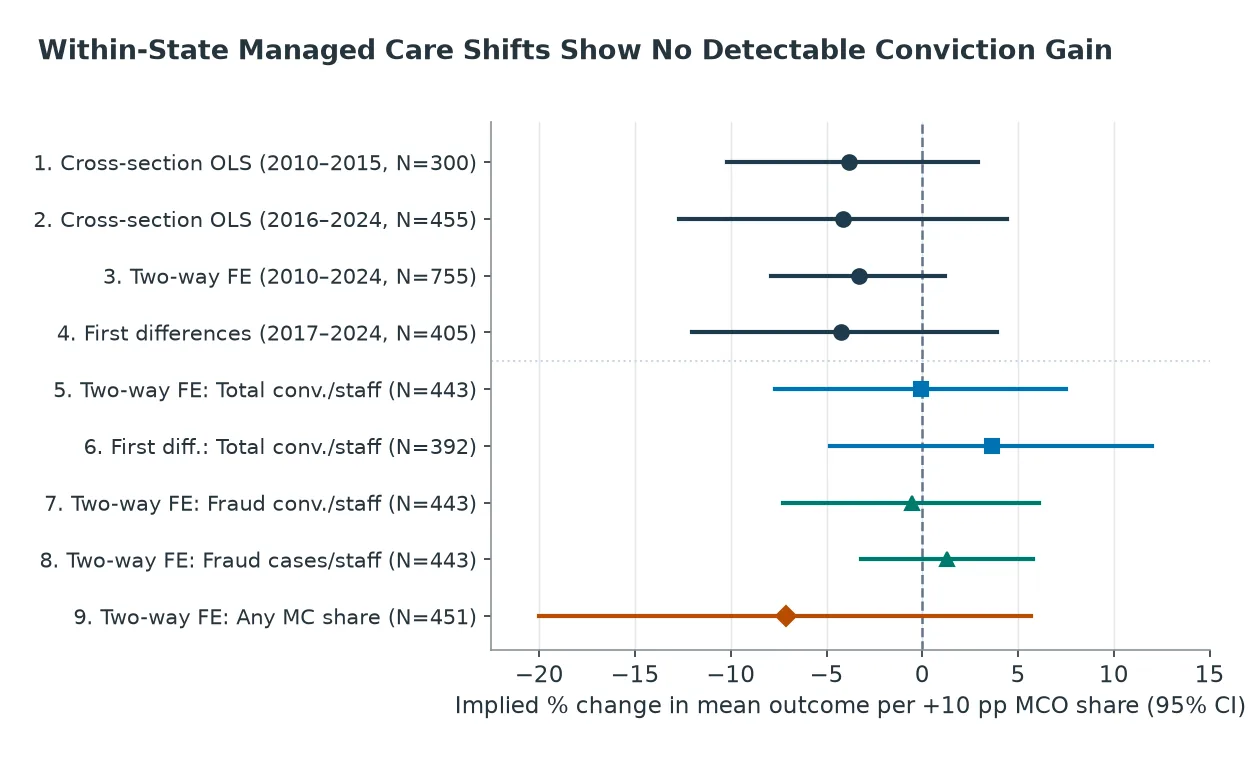
When we pair 15 years of state MFCU records with federal managed care series, we find no detectable within-state association.4, 5 In a two-way fixed effects (TWFE) model on the uniform 2016 to 2024 comprehensive MCO series (N = 443 across 51 jurisdictions), a 10 percentage-point rise in managed care enrollment corresponds to a -0.09% shift in mean total convictions per staff-year (slope = -0.007, SE = 0.311, p = 0.981, 95% CI [-7.7%, +7.5%]) and a -0.56% shift in fraud-only convictions per staff-year (slope = -0.031, SE = 0.189, p = 0.870, 95% CI [-7.3%, +6.1%]). In the 15-year harmonized TWFE panel (N = 755), the 95% confidence interval spans -7.9% to +1.2% of the mean per 10 percentage-point rise (slope = -0.280, SE = 0.194, p = 0.152). Across all nine panel and first-difference models, the estimates rule out large positive output gains while leaving smaller positive or negative shifts inside the confidence bounds.
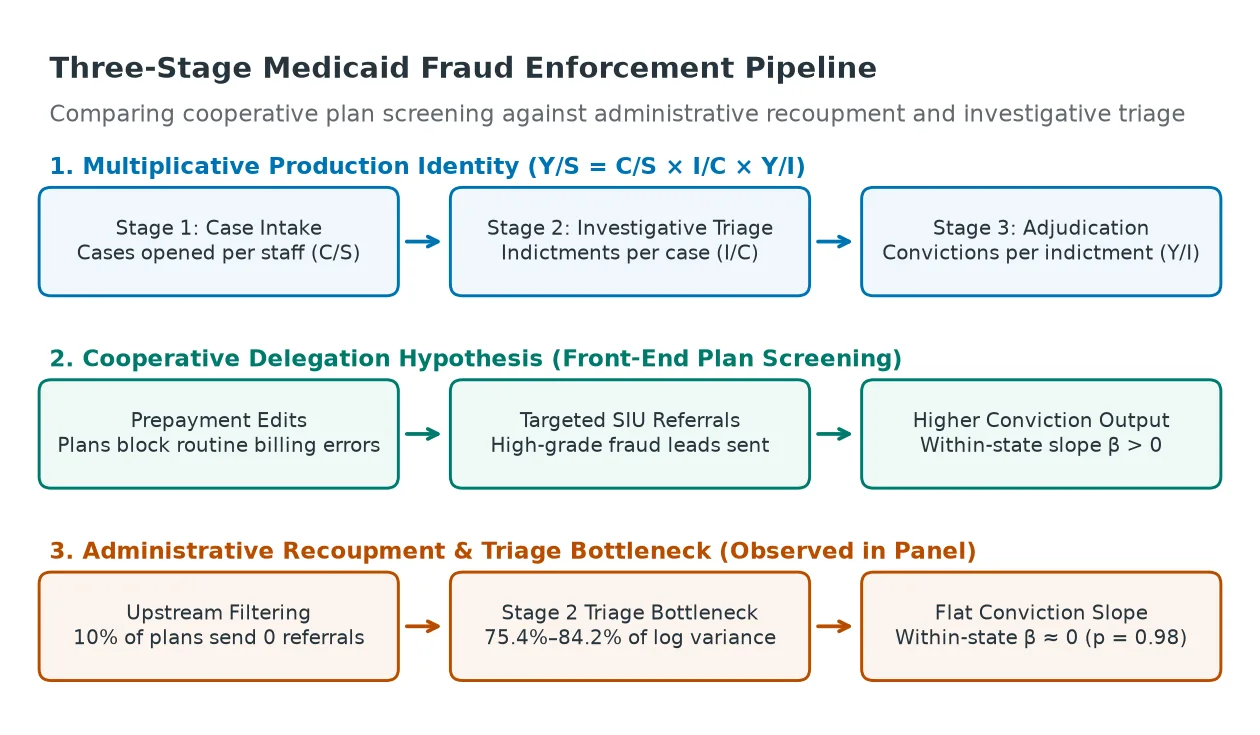
Meanwhile, total convictions per staff-year vary 17.9-fold across continuously operating states. If we examine aggregate convictions alone, we will miss where cross-state dispersion arises along the enforcement pipeline. To locate where cross-state differences sit, we can decompose state enforcement output per staff member into a descriptive three-stage accounting identity: case intake per staff member, indictments per opened case, and convictions per indictment (Figure 0).
Data and Design.
We pair annual HHS Office of Inspector General (OIG) statistical reports on 51 U.S. Medicaid Fraud Control Units (50 states and DC, FY 2010 to 2024, N = 755 state-years) with CMS managed care share series from CMS-64 expenditure reports and the uniform 2016 to 2024 CMS Managed Care Enrollment Summary (N = 443).1, 4, 5 Full panel regressions, variance decompositions, and replication scripts appear in the companion working paper (SSRN 7710301) and triage-decomposition repository.
Across the 50 continuously operating jurisdictions, Stage 2 investigative triage (indictments per opened case) accounts for 75.4% of the cross-state log variance in total convictions per staff-year (r = +0.58, p < 0.001). When we isolate fraud-only enforcement actions, Stage 2 triage accounts for 84.2% of cross-state log variance (r = +0.73, p < 0.001). Stage 1 case intake accounts for 24.6% of total variance (19.0% for fraud), while Stage 3 courtroom adjudication accounts for 0.0% (-3.2% for fraud). Because this decomposition is an accounting identity rather than a causal experiment, it measures where cross-state dispersion sits rather than proving what caused it. The accounting split shows that cross-state output differences cluster in investigative triage, where units evaluate raw leads and plan referrals for criminal indictment.
Three Stages of the Enforcement Production Function
Every state operates a federally certified MFCU, typically housed within the state Attorney General’s office, to prosecute healthcare provider fraud and patient abuse.4 When states carve benefits into capitated plans, public prosecutors lose direct access to state-paid fee-for-service claims and depend on plan Special Investigation Units (SIUs) to detect and refer suspected fraud.6, 7
To locate where cross-state output differences sit, we can write convictions per staff member (Yst / Sst) as a three-stage multiplicative accounting identity:
Here Sst denotes total unit staff, Cst denotes opened investigative cases, Ist denotes criminal indictments, and Yst denotes criminal convictions. Taking natural logarithms converts this product into an exact additive sum across the three ratios:
Because covariance is linear, each stage’s exact descriptive share of cross-state log variance equals its covariance with total log productivity divided by the total variance:
Two institutional hypotheses offer competing predictions for how managed care interacts with this three-stage funnel.
-
Cooperative Front-End Screening Hypothesis: Under a cooperative delegation view, capitated plans apply automated prepayment edits to block routine billing errors and forward well-documented fraud schemes to state prosecutors.3 If private plan SIUs supply higher-grade investigative leads as managed care expands, within-state increases in managed care share should be associated with higher MFCU convictions per staff-year.
-
Administrative Recoupment and Triage Filtering Hypothesis: Under an organizational filtering view, commercial capitation changes how plans label billing anomalies upstream while leaving criminal convictions governed by internal prosecutorial capacity and referral quality.8, 9 Federal rules require MCO contracts to mandate prompt referral of potential fraud (42 C.F.R. Section 438.608(a)(7)) and reporting of overpayments within 30 days (Section 438.608(a)(2)). In practice, state contract definitions vary from any potential fraud to credible allegations of fraud, referral timelines span 1 to 270 days, and 78% of plans share integrity staff across commercial, Medicare, and Medicaid lines.6, 10 Because proving criminal intent is costly and state contracts under Section 438.608(d) let plans keep routine overpayment recoveries, plans may prefer administrative recoupment over criminal referrals. In addition, aggressive fraud takedowns shrink the historical claims base used to set future actuarially sound capitation rates (Sections 438.4 and 438.5(c)) and reduce the 85% Medical Loss Ratio numerator (Section 438.8).2, 11 Without standardized encounter data and clear referral floors, the expansion of managed care yields no detectable gain in state conviction rates under this hypothesis.
Testing Within-State Managed Care Expansions
To test whether managed care expansion coincides with higher enforcement output within states, we estimate TWFE and first-difference regressions across 51 U.S. jurisdictions from fiscal year 2010 through 2024 (N = 755). Following prior Medicaid enforcement panels, we exclude Puerto Rico due to territorial funding caps and missing covariates, while North Dakota enters in fiscal year 2020 upon establishing its unit.4, 8, 12
When we work with multi-decade CMS managed care series, we must account for an administrative reporting boundary between 2015 and 2016. Before 2016, harmonized state series tracked enrollment shares from MACPAC and CMS summaries. Starting in 2016, CMS-64 financial management reports tracked expenditure shares, which sit 20 to 25 percentage points lower because high-cost populations are frequently carved out of capitated contracts. If we pool across 2015 and 2016 without checking each regime separately, that measurement step-shift can distort within-state slopes.
We can guard against that measurement break by estimating two parallel panels (Figure 1 and Table 1). Panel A covers the 15-year harmonized series (N = 755), while Panel B isolates the uniform 2016 to 2024 CMS Managed Care Enrollment Summary (N = 443). Because MFCUs prosecute both billing fraud and patient abuse or neglect (817 fraud convictions and 334 patient abuse or neglect convictions nationwide in FY 2024), Panel B also separates fraud-only convictions per staff-year (mean = 0.55) and newly opened fraud cases per staff-year (mean = 10.09) from total convictions per staff-year (mean = 0.81).4
import numpy as np
import pandas as pd
import statsmodels.formula.api as smf

# Within-state TWFE and three-stage covariance decomposition check
def decompose_three_stage_funnel(df_states: pd.DataFrame) -> dict:
    """Exact log-covariance shares for Y/S = (C/S) * (I/C) * (Y/I)."""
    ln_s1 = np.log(df_states["cases"] / df_states["staff"])
    ln_s2 = np.log(df_states["indictments"] / df_states["cases"])
    ln_s3 = np.log(df_states["convictions"] / df_states["indictments"])
    ln_tot = np.log(df_states["convictions"] / df_states["staff"])
    var_tot = np.var(ln_tot, ddof=1)
    shares = {
        "stage1_intake": np.cov(ln_s1, ln_tot, ddof=1)[0, 1] / var_tot,
        "stage2_triage": np.cov(ln_s2, ln_tot, ddof=1)[0, 1] / var_tot,
        "stage3_adjudication": np.cov(ln_s3, ln_tot, ddof=1)[0, 1] / var_tot,
    }
    assert np.isclose(sum(shares.values()), 1.0, atol=1e-6)
    return shares
Across all nine models in Table 1, within-state expansions of capitated managed care show no detectable positive association with public enforcement output at state-year precision.
| Specification & Panel Window | Outcome Measure | State-Years (N) | Mean Outcome | MC Slope (Clustered SE) | 95% CI per +10 pp (p-Value) |
|---|---|---|---|---|---|
| 1. Cross-Section OLS (2010–2015)Panel A: Enrollment Era | Total convictions / staff | 300 | 0.89 | -0.340(0.307) | [-10.2%, +2.9%]p = 0.273 |
| 2. Cross-Section OLS (2016–2024)Panel A: Expenditure Era | Total convictions / staff | 455 | 0.80 | -0.330(0.350) | [-12.7%, +4.4%]p = 0.346 |
| 3. Two-Way Fixed Effects (2010–2024)Panel A: Harmonized Series | Total convictions / staff | 755 | 0.84 | -0.280(0.194) | [-7.9%, +1.2%]p = 0.152 |
| 4. First Differences (2017–2024)Panel A: Annual Changes | Δ Total convictions / staff | 405 | 0.80 | -0.340(0.342) | [-12.0%, +3.9%]p = 0.320 |
| 5. Two-Way FE: Comprehensive MCOPanel B: Uniform CMS (2016–2024) | Total convictions / staff | 443 | 0.81 | -0.007(0.311) | [-7.7%, +7.5%]p = 0.981 |
| 6. First Differences: Comprehensive MCOPanel B: Uniform CMS (2017–2024) | Δ Total convictions / staff | 392 | 0.80 | +0.290(0.342) | [-4.8%, +12.0%]p = 0.401 |
| 7. Two-Way FE: Fraud Convictions OnlyPanel B: Uniform CMS (2016–2024) | Fraud convictions / staff | 443 | 0.55 | -0.031(0.189) | [-7.3%, +6.1%]p = 0.870 |
| 8. Two-Way FE: Fraud Case IntakePanel B: Uniform CMS (2016–2024) | Fraud cases opened / staff | 443 | 10.09 | +1.319(2.310) | [-3.2%, +5.8%]p = 0.571 |
| 9. Two-Way FE: Any Managed Care SharePanel B: Uniform CMS (2016–2024) | Total convictions / staff | 451 | 0.80 | -0.569(0.525) | [-20.0%, +5.7%]p = 0.283 |
In Panel A, cross-sectional regressions return negative, imprecise slopes during both the 2010 to 2015 enrollment era (-0.340, p = 0.273) and the 2016 to 2024 expenditure era (-0.330, p = 0.346). Including state and fiscal-year fixed effects across all 755 state-years yields a slope of -0.280 (SE = 0.194, p = 0.152). For a 10 percentage-point expansion in managed care share, the 95% confidence interval spans -7.9% to +1.2% of the sample mean (0.84 convictions per staff-year), ruling out productivity gains above 1.2%.
In Panel B, using the uniform 2016 to 2024 comprehensive MCO enrollment series (N = 443) removes the 2015/2016 reporting break. The baseline TWFE slope on comprehensive MCO share is -0.007 (SE = 0.311, p = 0.981), with a 95% confidence interval of -7.7% to +7.5% of the mean per 10 percentage-point increase. When we isolate fraud-only convictions per staff-year (Row 7), the slope is -0.031 (SE = 0.189, p = 0.870, 95% CI [-7.3%, +6.1%]). Upstream fraud case openings per staff-year (Row 8) also show no measurable shift (+1.319, SE = 2.310, p = 0.571, 95% CI [-3.2%, +5.8%]).
Decomposing the Cross-State Productivity Funnel
Where along the enforcement pipeline do cross-state differences in convictions per staff member arise? We can locate that dispersion by applying the three-stage log-variance accounting identity to state-pooled totals over FY 2010 to 2024 across the 50 continuously operating units (Figure 2 and Table 2). Because North Dakota opened its unit in FY 2020 and recorded 3 convictions and 12 indictments over five years, its small denominator widens the national max/min ratio from 17.9x to 45.9x; Table 2 reports the 50-unit baseline alongside the 51-unit sensitivity in parentheses.
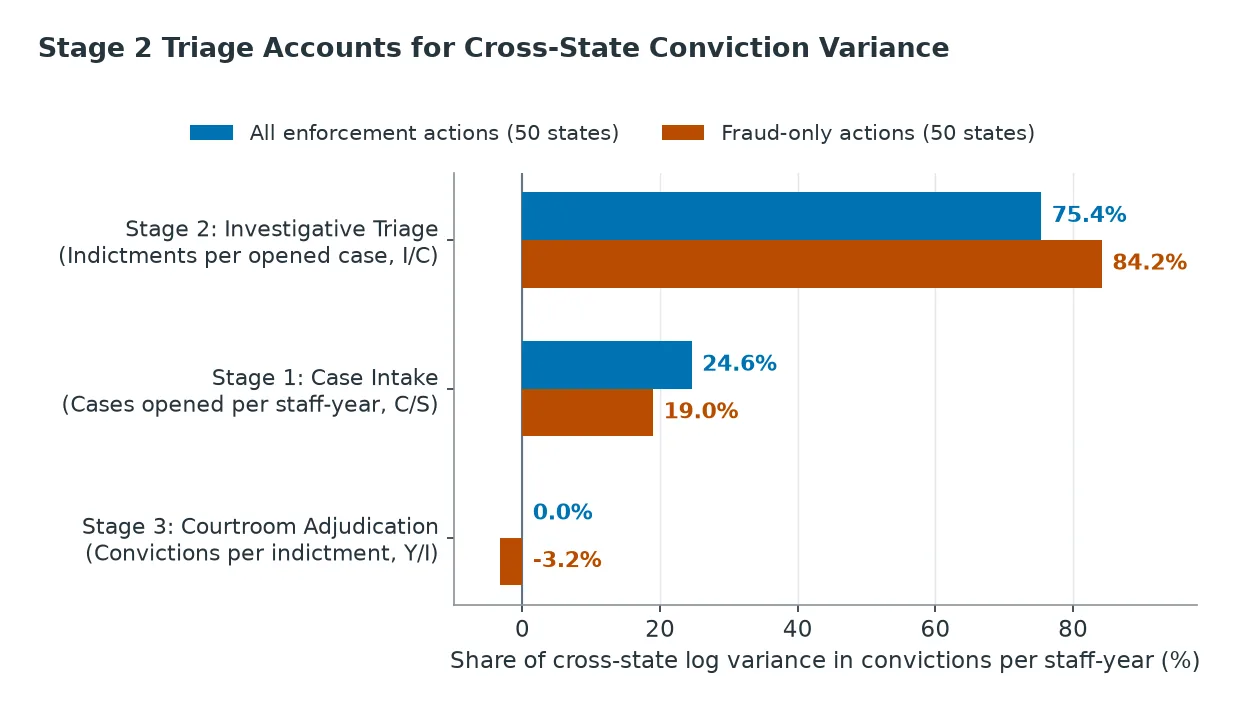
Moving backward from courtroom verdicts to initial intake reveals a clear accounting split across the three pipeline stages.
-
Stage 3 Courtroom Adjudication Is Uniformly High (0.0% of Variance): Across the 50 continuously operating units, convictions per indictment (Y / I) show a narrow 2.2x range and a coefficient of variation (CV) of 0.15. Stage 3 accounts for 0.0% of the cross-state log variance in total convictions per staff-year (r = -0.04, p = 0.781) and -3.2% for fraud-only convictions (r = -0.18, p = 0.201). Once a state unit secures an indictment, conviction rates cluster tightly between 0.75 and 0.95 in 32 of the 50 jurisdictions.
-
Stage 1 Case Intake Plays a Secondary Role (24.6% of Variance): Opened cases per staff-year (C / S) vary 12.2-fold across states (CV = 0.54) and account for 24.6% of total log variance (r = +0.37, p = 0.008). For fraud-only cases (CF / S), intake varies 13.0-fold and accounts for 19.0% of cross-state log variance (r = +0.20, p = 0.162).
-
Stage 2 Investigative Triage Accounts for Three-Quarters of Variance (75.4% to 84.2%): Indictments per opened case (I / C) vary 28.2-fold across all enforcement actions (CV = 0.72) and account for 75.4% of the cross-state log variance in total convictions per staff-year (r = +0.58, p < 0.001; 67.8% with North Dakota included). When we restrict the funnel to fraud-only actions in Panel B, fraud indictments per fraud case (IF / CF) vary 57.1-fold (CV = 0.81) and account for 84.2% of the cross-state log variance in fraud convictions per staff-year (r = +0.73, p < 0.001).
| Pipeline Stage & Panel | Operational Ratio | Max / Min Ratio | Coeff. of Variation (CV) | Log-Variance Share | Correlation with ln(Y/S) |
|---|---|---|---|---|---|
| Stage 1: Case IntakePanel A: All Actions (50 Units; 51 in parens) | Cases opened / staff (C/S) | 12.2x(12.2x) | 0.54(0.53) | 24.6%(20.7%) | r = +0.37p = 0.008 |
| Stage 2: Investigative TriagePanel A: All Actions (50 Units; 51 in parens) | Indictments / case (I/C) | 28.2x(28.2x) | 0.72(0.72) | 75.4%(67.8%) | r = +0.58p < 0.001 |
| Stage 3: Courtroom AdjudicationPanel A: All Actions (50 Units; 51 in parens) | Convictions / indictment (Y/I) | 2.2x(5.2x) | 0.15(0.18) | 0.0%(11.5%) | r = -0.04p = 0.781 |
| Combined Case ConversionPanel A: Stages 2 + 3 Combined | Convictions / case (Y/C) | 21.7x(31.4x) | 0.68(0.70) | 75.4%(79.3%) | r = +0.59p < 0.001 |
| Stage 1: Fraud Intake OnlyPanel B: Fraud Actions (50 Units) | Fraud cases / staff (CF/S) | 13.0x | 0.59 | 19.0% | r = +0.20p = 0.162 |
| Stage 2: Fraud Triage OnlyPanel B: Fraud Actions (50 Units) | Fraud indictments / case (IF/CF) | 57.1x | 0.81 | 84.2% | r = +0.73p < 0.001 |
| Stage 3: Fraud Adjudication OnlyPanel B: Fraud Actions (50 Units) | Fraud convictions / indictment (YF/IF) | 2.4x | 0.16 | -3.2% | r = -0.18p = 0.201 |
| Total Fraud ProductivityPanel B: Full Fraud Pipeline (50 Units) | Fraud convictions / staff (YF/S) | 13.1x | 0.77 | 100.0% | r = +1.00Reference |
Synthesis: What We Know, What We Cannot Prove, and Policy Design
What We Know From the Panel and Funnel Data
Combining the within-state panel regressions with the three-stage decomposition shows what aggregate state data can and cannot establish. Within states, expanding comprehensive MCO enrollment shows no detectable association with total convictions per staff-year (slope = -0.007, 95% CI [-7.7%, +7.5%], p = 0.981) or fraud-only convictions per staff-year (slope = -0.031, 95% CI [-7.3%, +6.1%], p = 0.870) at the panel’s precision. Across states, Stage 2 investigative triage (indictments per opened case) accounts for 75.4% to 84.2% of the log variance in conviction output.
Federal audit records point to a candidate mechanism consistent with this Stage 2 dispersion. In the OIG’s FY 2024 annual report, reviewed MCO referrals rose from 2,971 in FY 2021 to 4,650 in FY 2024, yet state MFCUs opened formal cases on only 23% (1,078 of 4,650) of those referrals.4 A 2025 OIG evaluation similarly found that 10% of surveyed Medicaid plans (covering 1.6 million enrollees and 8 billion dollars in payments across 13 states) sent zero fraud referrals in 2022, while more than half of referring plans sent two or fewer referrals per 10,000 enrollees.6 If plans recover routine overpayments internally under 42 C.F.R. Section 438.608(d) or send thin leads that lack proof of criminal intent, state units will face uneven intake at Stage 1 and high triage attrition at Stage 2.10 Moreover, as of November 2024, 28 of 53 MFCUs lacked federal approval to conduct independent data mining under 42 C.F.R. Section 1007.20, leaving them reliant on outside referrals.4
What the State-Year Panel Cannot Prove
Five methodological limits govern how we read these findings.
-
Observational State Timing and Statistical Precision: Because state managed care expansions do not occur at random, fixed-effects and first-difference slopes capture conditional within-state associations rather than causal shocks.13 In addition, while the 15-year TWFE confidence interval rules out gains above +1.2% per 10 percentage-point rise (and the 2016 to 2024 TWFE rules out gains above +6.1% to +7.5%), smaller positive or negative effects remain inside the confidence bounds.
-
Descriptive Accounting Identity vs. Causal Mechanism: The covariance shares of 75.4% and 84.2% describe where cross-state variance sits along the enforcement funnel. They do not prove that thin MCO referrals caused that dispersion or identify the marginal effect of adding staff without an exogenous staffing or contract shock.
-
Prosecuted Output vs. Underlying Fraud: Administrative records measure prosecuted cases rather than unobserved billing fraud.9 If managed care plans blocked fraud on the front end while prosecutors held output steady, a regression slope could also sit near zero. However, federal Payment Error Rate Measurement (PERM) audits review state capitation payments rather than provider-level managed care claims, and OIG audits document widespread zero-referral plans, so near-zero conviction slopes do not prove lower underlying fraud.6, 14
-
Short-Run First-Difference Precision: Annual first-difference confidence intervals (-4.8% to +12.0% per 10 percentage-point MCO expansion) are wider than the within-state TWFE bounds, leaving room for modest short-run swings.
-
Annual Flow Ratios: Because OIG statistical tables report annual counts rather than individual case cohorts, Stage 3 ratios compare convictions and indictments recorded in the same fiscal year. Pooling 15 years of state totals smooths out year-to-year cohort timing noise.
Policy Proposals for Medicaid Program Integrity
Because the descriptive variation sits in Stage 1 intake and Stage 2 triage, states can test three policy proposals.
-
Proposal 1 — Standardize MCO Referral Contracts and Evidentiary Floors: CMS and state Medicaid agencies can standardize contract definitions of reportable fraud under 42 C.F.R. Section 438.608(a)(7), set uniform reporting deadlines, and test whether requiring plan SIUs to attach billing and clinical records improves Stage 2 case-to-indictment conversion.10, 14
-
Proposal 2 — Mandate Encounter Visibility and Independent Data Mining: States can require near-real-time submission of both paid and denied MCO encounter claims to state data warehouses and expand federal data-mining approvals under 42 C.F.R. Section 1007.20 so MFCUs can screen across plans on their own.4
-
Proposal 3 — Test Stage 2 Forensic and Investigative Staffing: Using the 75% federal MFCU matching rate to hire forensic auditors and investigators offers a testable way to evaluate whether expanding Stage 2 triage capacity raises indictment conversion in low-conversion units.8, 12
References
- Centers for Medicare & Medicaid Services. (2024). Medicaid Managed Care Enrollment and Program Characteristics, 2022–2024. Baltimore, MD: U.S. Department of Health and Human Services. ↑
- Medicaid and CHIP Payment and Access Commission (MACPAC). (2022). MACStats: Medicaid and CHIP Data Book. Washington, DC: MACPAC. ↑
- Sanchez, M., Miller, B., & DiGiorgio, L. (2026). Improving Medicaid program integrity through managed care. Health Affairs Forefront, October 5, 2026. ↑
- Office of Inspector General. (2025). Medicaid Fraud Control Units Fiscal Year 2024 Annual Report (OEI-09-25-00090). Washington, DC: U.S. Department of Health and Human Services. ↑
- Cholette, V. (2026). Privatizing Program Integrity? Managed Care Penetration and Medicaid Fraud Enforcement. SSRN Working Paper No. 7710301. https://papers.ssrn.com/sol3/papers.cfm?abstract_id=7710301 ↑
- Office of Inspector General. (2025). Some Medicaid Managed Care Plans Made Few or No Fraud Referrals (OEI-03-22-00410). Washington, DC: U.S. Department of Health and Human Services. ↑
- Office of Inspector General. (2024). Medicaid Fraud Control Units Encounter Challenges Overseeing Managed Care Fraud (OEI-03-23-00340). Washington, DC: U.S. Department of Health and Human Services. ↑
- Perez, V., & Wing, C. (2019). Should we spend more on policing Medicaid fraud? Evidence from the Medicaid Fraud Control Units. American Journal of Health Economics, 5(4), 481–508. doi:10.1162/ajhe_a_00130 ↑
- Nguyen, H., & Perez, V. (2020). Privatizing plaintiffs: How Medicaid fraud litigation responds to decentralized whistleblowers. Journal of Health Economics, 74, 102378. doi:10.1016/j.jhealeco.2020.102378 ↑
- Office of Inspector General. (2026). States Require Managed Care Plans To Refer Suspected Fraud, But Oversight Gaps Remain (OEI-03-23-00341). Washington, DC: U.S. Department of Health and Human Services. ↑
- Office of Inspector General. (2024). CMS Oversight of State-Submitted Medicaid Managed Care Medical Loss Ratio Data (OEI-03-22-00100). Washington, DC: U.S. Department of Health and Human Services. ↑
- Perez, V., & Ramos, M. (2023). Finding fraud in health insurance: Does the Affordable Care Act matter? Journal of Policy Analysis and Management, 42(3), 754–781. doi:10.1002/pam.22481 ↑
- de Chaisemartin, C., & D'Haultfœuille, X. (2020). Two-way fixed effects estimators with heterogeneous treatment effects. American Economic Review, 110(9), 2964–2996. doi:10.1257/aer.20181169 ↑
- U.S. Government Accountability Office. (2025). Medicaid: Actions Needed to Strengthen Program Integrity and Address Managed Care Risks (GAO-25-107770). Washington, DC: GAO. ↑
Cite this article
Cholette, V. (2026, November 15). Medicaid Managed Care and Fraud Enforcement: Investigative Triage Accounts for State Output Gaps. Too Early To Say. https://tooearlytosay.com/research/health-policy/medicaid-managed-care-fraud-triage/