Session two starts from zero
The first-session walkthrough closes with an exercise: exit Claude Code, open a new session rather than resuming the old one, and ask it to continue. A new session begins with a fresh conversation context. Claude Code can resume saved sessions, and its optional auto memory can carry selected notes, but neither mechanism guarantees that a new session reconstructs every project decision. This page addresses the new-session case by putting the durable instructions in project files.
The fix points toward files. A new session does not alter the project folder. Writing durable instructions there gives Claude Code context it can load in later sessions, although the instructions remain guidance rather than enforced configuration. claude-code-econ-starter supplies seven starter resources for an economist opening Claude Code on a real project. Five are copied by the setup below; the glossary and printable desk reference remain available from the repository and this page. Setup time depends on existing files and the amount of project-specific detail added to the template.
The kit also addresses correctness. The tool can write code that looks right and is wrong, and verification remains our responsibility. The kit includes a pass or fail verification routine. The demonstration below applies it to an aggregation bug that ordinary output inspection would not identify.
Copy-paste protocol
Installing this kit means copying files; there is nothing to compile and no package manager involved. Option A is a runnable instruction pasted into Claude Code inside the project:
Work only in the current project and in ~/.claude/skills/.

1. Create a uniquely named temporary directory and clone
   https://github.com/dphdame/claude-code-econ-starter into it.
2. Resolve and display the exact source and destination paths.
3. Check these destinations before copying:
   ./CLAUDE.md
   ./verification-checklist.md
   ~/.claude/skills/session-notes
   ~/.claude/skills/validate-estimator
   ~/.claude/skills/first-skill-template
4. STOP and ask if any destination already exists, a path is ambiguous,
   or a required source is missing. Do not overwrite, merge, or guess.
5. Create ~/.claude/skills/ if needed, then copy only the five resources
   listed above.
6. Verify every copied path and report the source commit hash plus an exact
   destination list.
7. Delete only the unique temporary directory created in step 1, and only
   after every copy and verification succeeds. On any failure, leave it in
   place and report its exact path.
The guard clauses make the series thesis concrete: a precise specification is what lets an agent do useful work. Here the specification names every target, stops on conflicts, and makes cleanup conditional on verification.
Option B copies the same five resources from Bash or Zsh. It refuses to overwrite an existing destination, creates the personal skills directory when needed, and retains its uniquely named temporary clone for inspection:
install_tets_starter() {
  local starter_tmp starter_repo target
  starter_tmp="$(mktemp -d)" || return 1
  starter_repo="$starter_tmp/claude-code-econ-starter"

  git clone --depth 1 \
    https://github.com/dphdame/claude-code-econ-starter.git \
    "$starter_repo" || return 1
  mkdir -p "$HOME/.claude/skills" || return 1

  for target in \
    "./CLAUDE.md" \
    "./verification-checklist.md" \
    "$HOME/.claude/skills/session-notes" \
    "$HOME/.claude/skills/validate-estimator" \
    "$HOME/.claude/skills/first-skill-template"
  do
    if [ -e "$target" ]; then
      printf 'STOP: destination exists: %s\n' "$target" >&2
      printf 'Temporary clone retained at: %s\n' "$starter_repo" >&2
      return 1
    fi
  done

  cp "$starter_repo/templates/CLAUDE.md" ./CLAUDE.md || return 1
  cp "$starter_repo/checklist/verification-checklist.md" \
    ./verification-checklist.md || return 1
  cp -R "$starter_repo/skills/session-notes" \
    "$starter_repo/skills/validate-estimator" \
    "$starter_repo/skills/first-skill-template" \
    "$HOME/.claude/skills/" || return 1

  printf 'Source commit: '
  git -C "$starter_repo" rev-parse HEAD
  printf 'Copied: %s\n' \
    "$PWD/CLAUDE.md" \
    "$PWD/verification-checklist.md" \
    "$HOME/.claude/skills/session-notes" \
    "$HOME/.claude/skills/validate-estimator" \
    "$HOME/.claude/skills/first-skill-template"
  printf 'Temporary clone retained at: %s\n' "$starter_repo"
}

install_tets_starter
unset -f install_tets_starter
Under either path, five of the seven resources are copied: the context file, the checklist, and the three skills. They go to two different places, and the difference between those places matters. Option A removes only its newly created temporary directory after verification; Option B prints and retains its temporary path so we can inspect it before removing it ourselves. The glossary and desk reference come back a few paragraphs below.
The context file and checklist go into the project folder itself. CLAUDE.md is a plain markdown file that Claude Code loads as project instructions when the session starts within the applicable directory hierarchy. Anthropic’s memory documentation emphasizes that these instructions are context, not enforced configuration; concise, specific instructions are followed more consistently. The conventions from session one now live in a durable file available to later sessions, but the file does not guarantee compliance or eliminate clarification.
The three skills go somewhere else: ~/.claude/skills/, the personal skill location documented for local Claude Code sessions. A direct command such as /validate-estimator loads that skill’s instructions when the skill remains user-invocable; its description can also help Claude select it when relevant. The instruction file guides a model-driven run, so the command does not promise identical steps or output and does not bypass permission checks. Anthropic documents the current behavior on its skills page, and the TETS setup guide walks through a first invocation.
The last two resources are not copied by either protocol. GLOSSARY.md defines ten week-one terms, each with one line on why it matters for research, and pairs with the first-session walkthrough. The desk reference is two printed pages: the checklist with checkboxes plus the same glossary. It also prints from this site: open the printable and print from the browser.
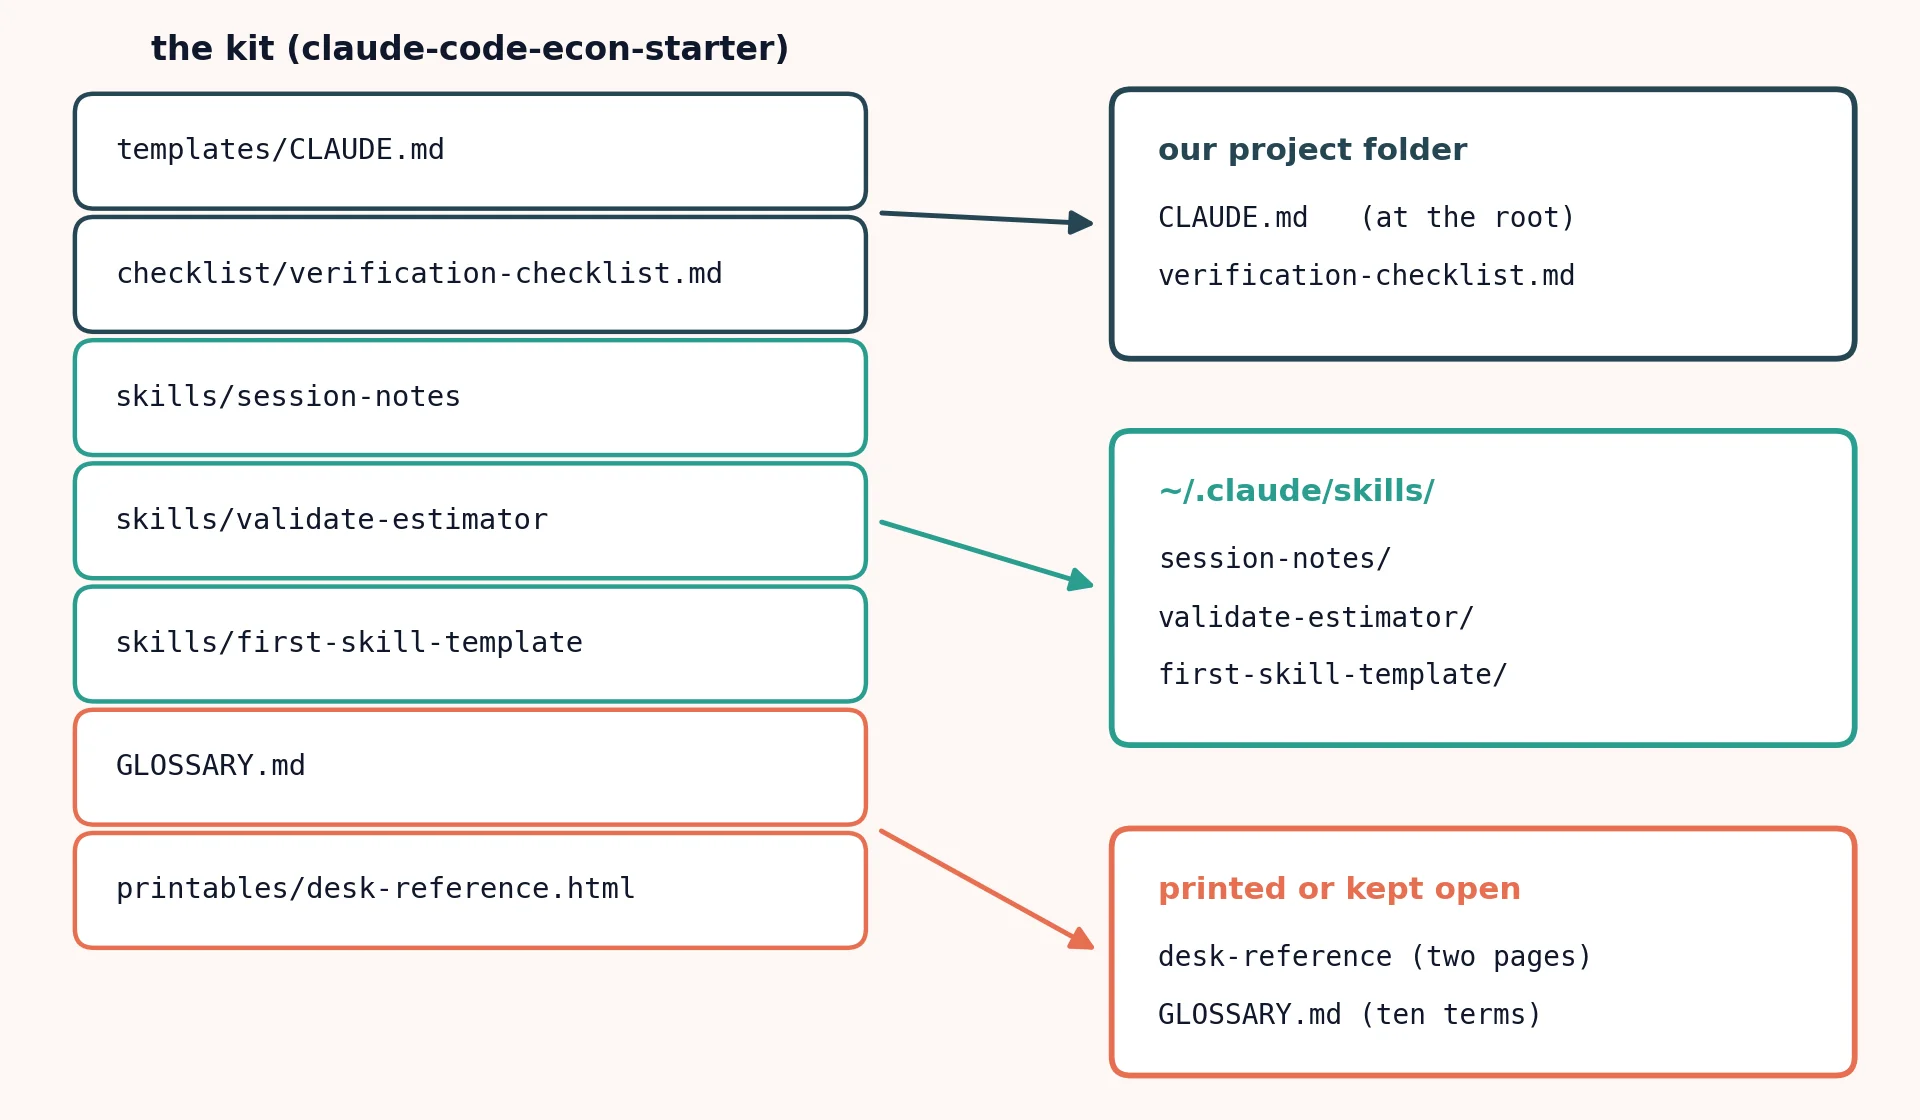
The copy operation is short; most setup time goes into the template’s brackets. Every placeholder asks for project information such as the canonical analysis file, the geographic identifier convention, and the current specification. If we fill the brackets now, the next session receives the Federal Information Processing Standards (FIPS) code convention as project context. If we skip them, the template carries no project-specific fact to load.
What each file does
Each of the seven files stands alone; taking one is as supported as taking all seven. Take only the checklist and it covers its cost the first time a check fails.
| File | What it does in plain terms | Design rationale |
|---|---|---|
| templates/CLAUDE.md | Project instructions that persist on disk: data conventions, file organization, current focus, and known pitfalls, loaded as context in applicable sessions | Why these sections |
| checklist/verification-checklist.md | 13 pass/fail checks across citations, estimator code, and empirical claims; the tool satisfies them before a human reads the output | Why these items |
| skills/session-notes | A five-minute end-of-session capture into a dated note: what changed, why, what comes next, what failed | Why capture |
| skills/validate-estimator | The planted-truth routine demonstrated below: plant a known effect, require the implementation to recover it | Why this routine |
| skills/first-skill-template | Guided creation of a first custom skill from whichever task we keep re-explaining | Why this structure |
| GLOSSARY.md | Ten week-one terms, from commit to compaction, each with one line on why it matters for research | Why a token budget |
| printables/desk-reference.html | Two printed pages: the checklist with checkboxes plus the glossary | Same items as the checklist and glossary |
The practices in the kit have a long lineage: standard software engineering plus the simulation checks econometrics has run for decades, with the design rationale for each file in the articles linked in the table above. For a lecture-length walkthrough of this territory aimed at economists, Paul Goldsmith-Pinkham’s Claude Code for empirical research series (Markus Academy) works through it across eight episodes, and the lectures are worth watching alongside the setup.
One glossary entry deserves a preview, because it names the force behind this whole article. The first-session walkthrough mentioned that long sessions eventually fill the context window, the bounded amount of text the model considers at once. Claude Code can compact a long conversation into a summary as the window fills. Details that remain only in the conversation may be omitted from that summary; a decision written to a project file still exists on disk and can be loaded again. The budgeting logic for treating the window as a scarce resource is worked out in the context-window article.
The seven files split into infrastructure and seed. The template’s sections, the checklist’s thirteen checks, and the verify_estimator function below are shipped infrastructure, designed to be lifted whole. The three skills and ten glossary terms are a starter seed, and the first-skill-template skill is the mechanism for growing it: the skills we eventually write for our own projects (robustness batteries, table formatting, referee-memo prep) are what keep saving time on each next project.
How much of it is tested
The repository had no published release or git tag when checked on July 21, 2026. Its README records testing with Claude Code v2.1.205, so compatibility outside that version is not established by the repository. That badge is a maintainer report, not an independent compatibility matrix. The public validate-estimator directory provides the generic NumPy helper shown below, but it does not provide the complete simulated data-generating process, estimator wrappers, dependency lockfile, or saved output for this demonstration. The numerical table and distribution figure are therefore article-reported illustrations, not publicly reproducible outputs. A fixed seed controls the pseudorandom sequence in a recorded environment; it does not supply unpublished implementation artifacts or guarantee identical output across operating systems and numerical libraries.
Breadth is what remains untested. Three skills, a ten-term glossary, and a template whose examples assume a Python or R workflow, with no Stata-specific conventions yet. The conventions encoded reflect one applied microeconomist’s projects. If our work is applied micro in Python or R, the template fits as shipped; a structural or macro workflow rewrites parts of it before trusting it.
Watching the check catch a bug
An estimator implementation runs without error and prints a coefficient in a plausible range. What have we learned about whether it estimates the right quantity? Nothing; a clean run carries no signal either way. The validate-estimator skill packages the oldest answer simulation econometrics has to that problem: test the code on data built around a truth we already know. The instrument for that is a data generating process, a DGP: a small program that manufactures fake data where we chose the true effect ourselves, so we know what the right answer is. An implementation that cannot recover an effect we planted has no business estimating an effect we are trying to discover.
The skill carries a small generic tool, copied here verbatim from the skill file:
import numpy as np

def verify_estimator(estimator, simulate_dgp, true_effect, tol, reps=1000, seed=0):
    """Plant a known effect, run the estimator across many draws, and check
    whether the mean recovers the truth. Catches biasing bugs; it does NOT
    validate identification, and it misses bugs that leave the estimate
    unbiased (see the limits section)."""
    draws = np.array([
        estimator(simulate_dgp(true_effect, np.random.default_rng(seed + i)))
        for i in range(reps)
    ])
    bias = draws.mean() - true_effect
    return {"mean": float(draws.mean()), "bias": float(bias), "passed": bool(abs(bias) <= tol)}
In plain terms: the function manufactures 1,000 fake datasets (each one is a draw), runs the estimator on every draw, and averages the 1,000 estimates. An average within ±0.05 of the planted effect passes; anything further fails. The seed of 0 fixes the pseudorandom sequence for a recorded NumPy environment.
To exercise the tool we plant a truth inside a staggered-adoption difference-in-differences, the kind of design many of us estimate every week. Cohort A is 30 counties adopting at period 3 of a nine-period panel indexed 0 through 8, so treatment covers periods 3 through 8 and each county contributes 6 treated periods: 30 × 6 = 180 treated county-by-period observations, which we will call cells, each receiving a per-cell effect of 2.0. Cohort B is 120 counties adopting at period 6, treated in periods 6 through 8 for 3 treated periods each: 120 × 3 = 360 cells at a per-cell effect of 0.5. One hundred never-treated counties serve as controls. The planted average effect is the cell-weighted mean across all treated cells, and the arithmetic is worth writing out in full:
(180 × 2.0 + 360 × 0.5) / (180 + 360) = (360 + 180) / 540 = 540 / 540 = 1.00.
The setup deliberately uses unequal cohort sizes, treatment timing, and effects. Those asymmetries make an omitted weight change the aggregate. With balanced data, the plain and weighted means coincide, so the same bug would pass the check; the limits section demonstrates that case.
Two implementations of the aggregation step go through the tool. Both compute the same two cohort-level estimates, e_a and e_b, from identical first lines. They differ in exactly one line, the return. The correct line combines the cohort estimates with treated-cell weights:
return (e_a * CELLS_A + e_b * CELLS_B) / (CELLS_A + CELLS_B)The buggy line takes a plain average of the two cohort estimates, as if 30 counties and 120 counties deserved equal say:
return (e_a + e_b) / 2.0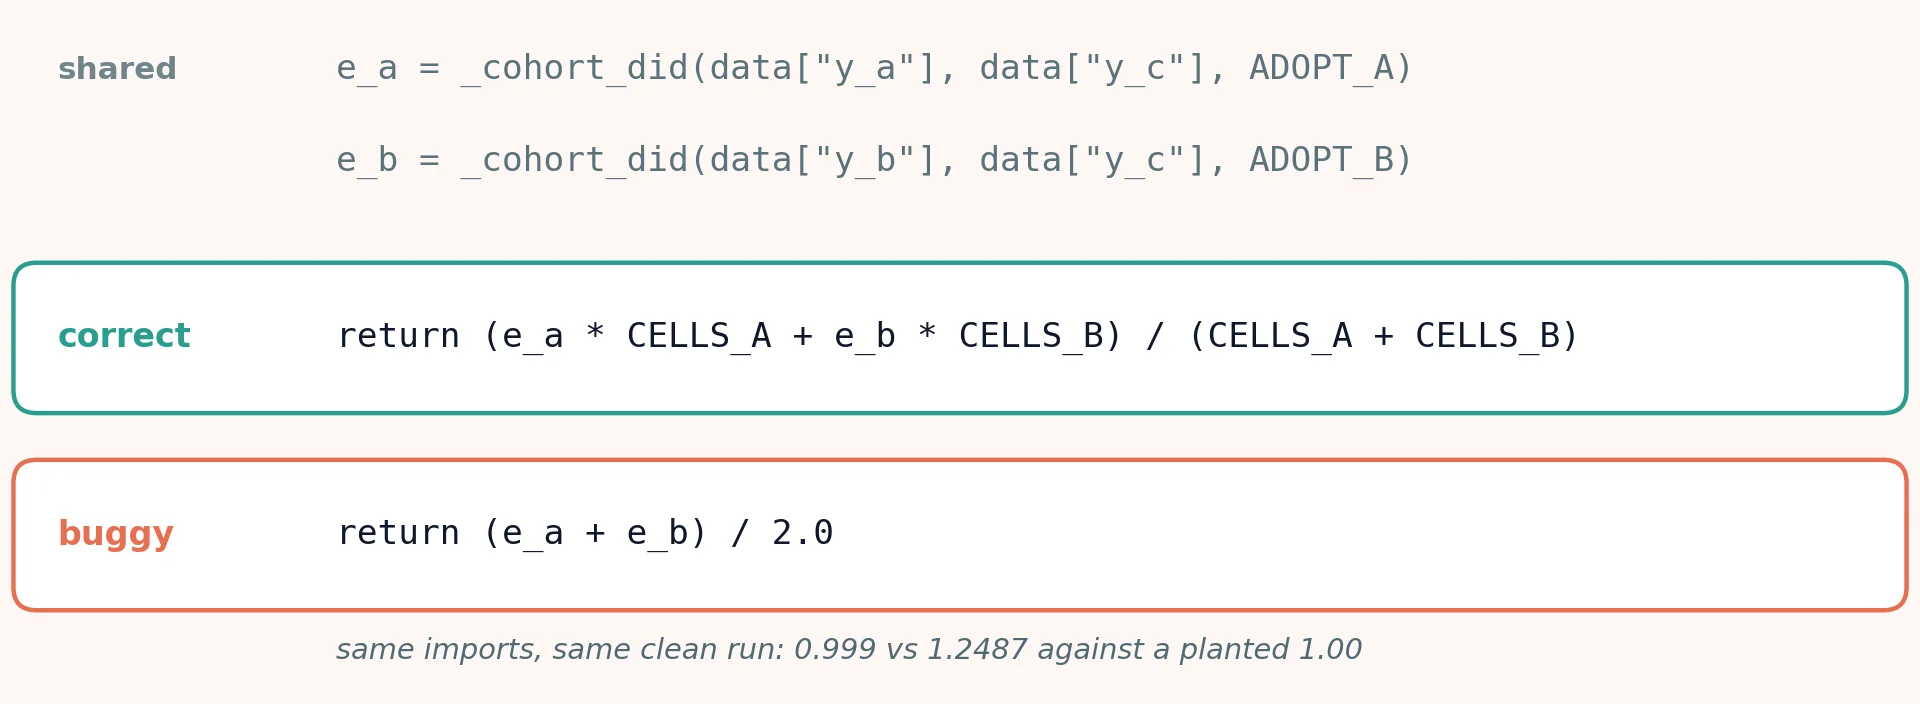
The substitution is an easy one for an AI assistant to make, because everything imports and runs cleanly either way. The article reports the following illustrative outputs. No complete public reproducer currently derives them:
| Implementation | Mean over 1,000 draws | Single draw (seed 0) | Verdict at tolerance ±0.05 |
|---|---|---|---|
| Cell-weighted combination (correct) | 0.999 | 0.996 | pass |
| Plain mean over cohorts (the bug) | 1.2487 | 1.2405 | fail |
In the article-reported illustration, the single-draw column is the number one clean run prints, the number a memo would quote. The mean over 1,000 draws is what the check judges, and the reported value of 1.2487 sits outside ±0.05 of the planted 1.00.
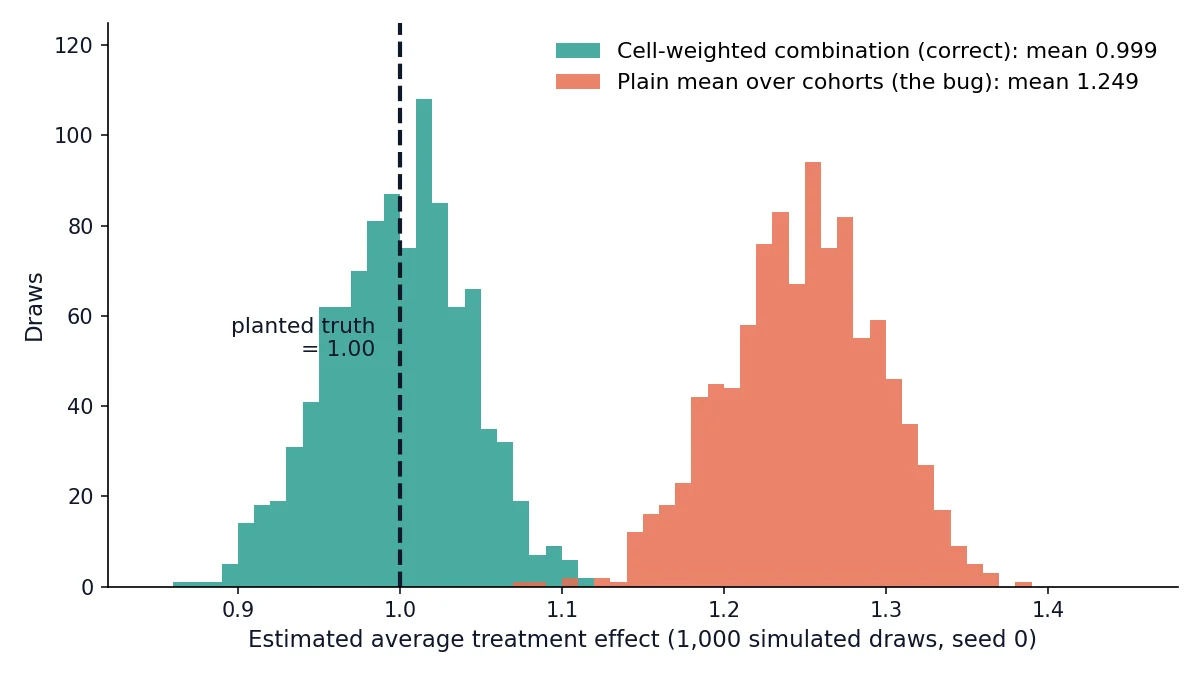
In the article-reported illustration, relying on the clean run would produce a memo reporting 1.24 where the true effect is 1.00, overstating the program by roughly a quarter. An agency scaling the program into the later-adopting counties, where the true per-cell effect is 0.5, would then budget against returns the data do not contain. Running the check before reporting flags the estimate and prevents its use in the memo. On the kit’s checklist this is items 8 and 9 doing their work: item 8 requires the planted value to be recovered within a stated tolerance, and item 9 requires the simulated data to break the easy symmetries so a dropped weight produces a detectable difference.
What the check cannot catch
The article reports that the same buggy estimator returns 1.0001 and passes when rerun on symmetric data with equal treated-cell counts and one common effect across cohorts. That numerical result is illustrative and not publicly reproduced. The aggregation code still contains the bug, but a plain mean and a weighted mean coincide exactly when the cells balance. On balanced simulated data, the check therefore does not detect the omitted weight. That is why item 9 exists: a bug that the planted process never exercises goes undetected.
The check also misses two categories of error. Bugs that leave the estimate unbiased never change the mean across draws, so no tolerance can flag them. An error that changes the order in which observations are processed is one example: individual estimates can vary without systematic bias, leaving the average across 1,000 draws unchanged. Checklist item 10 addresses these errors through a line-by-line comparison of the implementation with the source. Identification problems form the second category: recovering a planted value validates the implementation, not the design. Whether parallel trends is credible in the real data remains a human judgment. The routine work can be recorded in files; responsibility for interpreting the estimate remains with us.
Next steps
A reasonable second session copies the kit in through either install path, fills the template’s brackets for one live project, and prints the desk reference; GLOSSARY.md next to the keyboard covers most of the vocabulary the next few sessions will surface. Readers following the AI for Applied Researchers sequence will find this kit running underneath all five steps; if we set it up before step one, every later step inherits it. When a project reaches the figures stage, we cover a structured way to produce publication-quality graphics in Claude Visualizations Not Working? The Antigravity Fix.
The practices in these files were worked out one live project at a time across our Claude Code series: the context file in One Context File, Zero Re-Explanations, the validation questions behind Grocery Store Classifier Results Under Review, and the resilience patterns in Robust API Collection: Pagination, Rate Limits, Failure Recovery, whose execution values remain under reconciliation. The first-session walkthrough pairs with GLOSSARY.md for the first hour at the keyboard. A useful second-week task is creating a first custom skill. /first-skill-template saves a repeatedly explained task as a file with explicit steps and success criteria. As project-specific skills accumulate, we rely less on the starter skills.
Four actions to reuse
- Persist repeated conventions. Add a convention to
CLAUDE.mdafter explaining it in three consecutive sessions. - Verify every clean run. Complete the checklist before using an output in analysis or reporting.
- Test known truths and asymmetries. Plant a known effect, vary convenient symmetries, and compare the implementation line by line with the source. Simulation does not resolve identification.
- Capture the session. Use the session-notes skill to record what changed, why, what failed, and what comes next before ending or compacting a session.
Have input? Get in touch.