Open the Anthropic Economic Index from its March 24, 2026 update and we get a careful, well-bounded story. Four million Claude conversations, mapped to the U.S. Department of Labor’s O*NET taxonomy of occupations and tasks. A privacy-preserving analysis pipeline (Clio) that anonymizes and aggregates before any human reads cluster patterns. A productivity-gain estimate of 1.8 percentage points per year, honestly adjusted downward to 1.0–1.2 once Anthropic accounts for the tasks Claude does not yet complete reliably. A breakdown of how often the conversations look like augmentation (52%) versus automation (45%) as of late 2025. Recurring releases. Limitations stated up front.
Before the Index, “AI’s effect on the labor market” was largely speculation about which occupations might be exposed. Now we have a recurring, primary-source account of which task families show up in actual conversations with one major frontier model, with privacy norms and methodology disclosed.
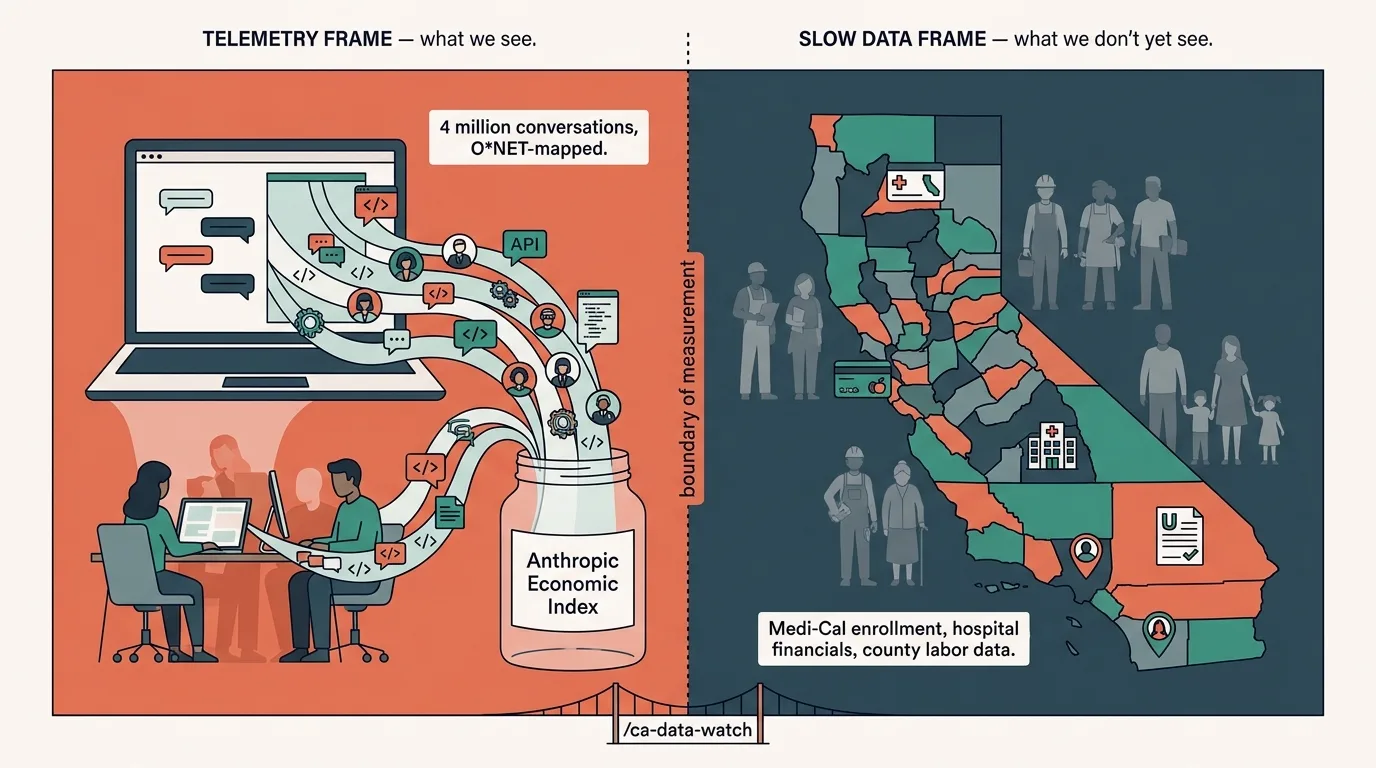
Anthropic itself draws the boundary. The Primitives report says it cleanly: “even our revised assessment is still limited: we only assess tasks that are performed on Claude.ai, and it’s not always clear how these conversations might map onto changes in the real world.” The arXiv paper that anchors the methodology says it again. The data “only paint a picture of AI usage on a single platform.”
So we have a measure of what shows up in the telemetry. We do not yet have a measure of what shows up outside the telemetry.
What sits outside the frame
The people who sit outside the telemetry are the ones a household-wellbeing frame most needs to surface. Workers who never adopted Claude. Workers whose jobs were restructured before any LLM was deployed. Second-order effects on households whose income flows shift when an AI-exposed occupation in the next ZIP code stops hiring.
These effects bypass the telemetry layer entirely. They show up as Medi-Cal enrollment changes when a paycheck disappears, as food-stamp applications when a household’s earnings drop below the threshold, as county-level unemployment claims, school enrollment shifts, and social-service caseload changes that move slowly and asymmetrically across the state.
Those signals live in slow, fragmented, public-sector data systems that nobody reports on monthly because no AI lab owns them, no platform measures them, and no one entity has an incentive to keep them current. State Medicaid agencies release monthly enrollment files. County health departments publish hospital financial data quarterly. The state Controller publishes county expenditure reports annually, in February. The Department of Finance publishes population estimates in May. Each portal lives on its own schedule, with its own update indicators, and the only way to know when something changed is to check.
If we want a measurement frame that captures AI’s impact on the people who don’t show up in adoption curves, that frame has to live inside those slow data systems. And the same AI tooling that makes the Economic Index possible can build the parallel infrastructure that keeps those slow systems legible.
The role is the glue layer between those agencies and the research workflow: it catches when any of them release something new, surfaces what changed, and feeds the change in before the analyst has to remember to check.
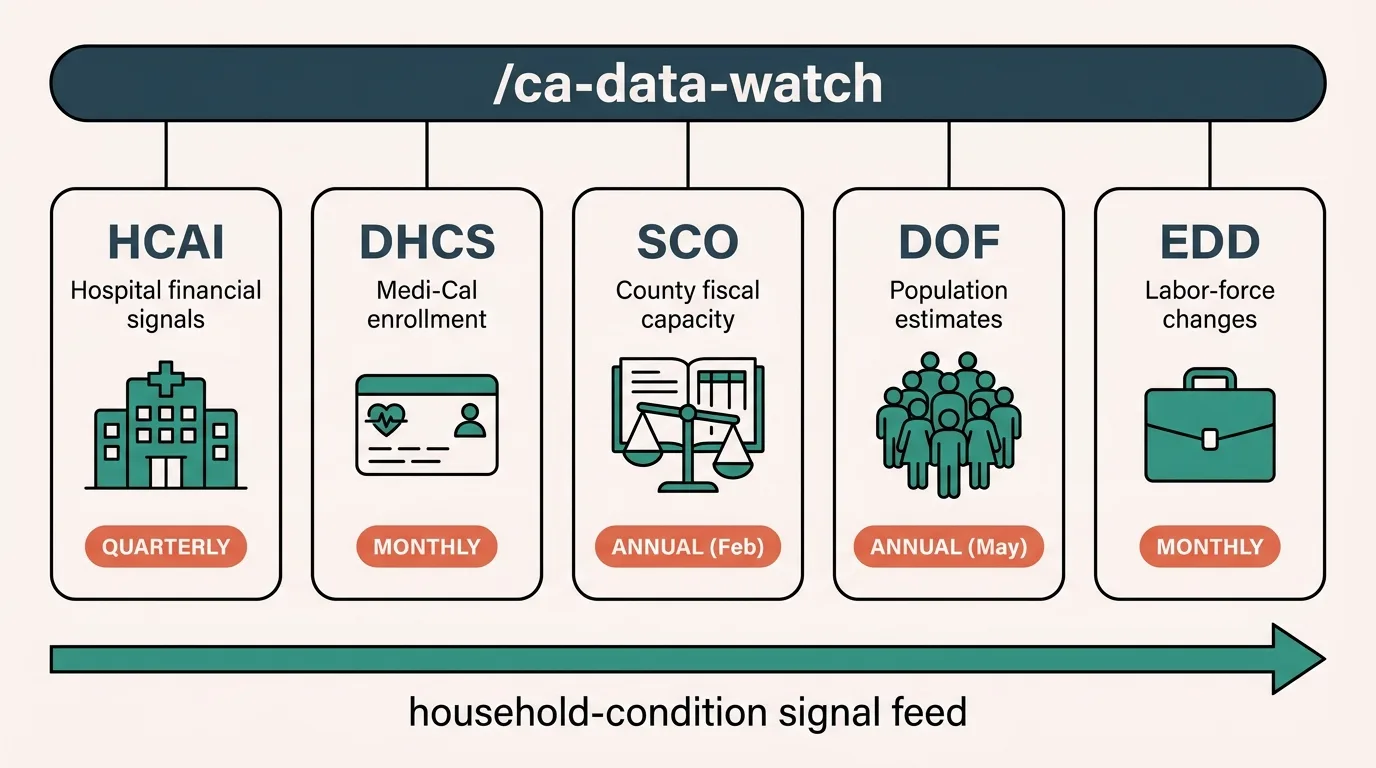
What follows is a worked example: a Claude Code skill called /ca-data-watch that monitors five California portals, HCAI (hospital financials), DHCS (Medi-Cal enrollment), the State Controller (county finance), DOF (population estimates), and EDD (employment), each a signal source for one slice of household conditions. They cannot tell us why something moved. They can tell us that it moved, the week it moved, instead of months later.
The slow-data layer in practice
Reading these portals as signal sources for household conditions runs into a calendar problem. Each one publishes on its own schedule. DHCS publishes monthly Medi-Cal enrollment figures. The State Controller releases annual county data in February. DOF publishes population estimates in May. HCAI releases hospital financials quarterly. EDD publishes monthly employment data. Keeping track of when to check which source requires a calendar, a checklist, or a good memory.
The manual process: open portal, find the last-updated date, compare to memory, repeat. Time: 15–30 minutes per check, assuming nothing distracts. More often, the check gets postponed until a specific analysis needs the data. And when the check gets postponed, the slow-data layer stops functioning as a signal feed and starts functioning as an archive: useful for backward-looking work, useless for catching what just happened.
What the parallel infrastructure has to do
Automating the check requires three capabilities:
- Navigate to each data portal and extract update indicators
- Compare the current state against a tracking file
- Report which sources have new data
A fourth capability matters when the AI part of the pipeline starts touching content rather than just metadata: the verification layer that catches misread dates or hallucinated headers before they get cached as “last known” state.
The first part needs browser automation. Government data portals are not designed for programmatic access. Some have APIs; most do not. The practical approach is loading the page like a human would and extracting the relevant information. This is the same browser-automation pattern that powers academic literature surveillance.
Agent Browser provides this capability. It loads pages in a real browser, making it harder for sites to detect automation. The accessibility tree extraction gives structured access to page content without fragile CSS selectors.
The tracking file
Before checking for updates, the system needs to know what “updated” means. This requires storing the last-known state of each data source.
A JSON tracking file holds this information:
{
  "sources": {
    "hcai": {
      "name": "Healthcare Access and Information",
      "url": "https://hcai.ca.gov/data/cost-transparency/hospital-financials/",
      "last_checked": "2026-04-25",
      "last_known_update": "2025-Q4",
      "datasets": [
        {
          "name": "Hospital Financial Data",
          "last_known_date": "2024"
        }
      ]
    }
  }
}
Each source entry includes:
- The URL to check
- When it was last checked
- The most recent update that was found
- Specific datasets with their individual update dates
The skill compares what it finds on the page against these stored values. A discrepancy means new data.
Source-specific extraction
Each data portal presents update information differently. The skill needs source-specific logic. And because each source signals a different slice of household conditions, the skill also needs to know what each source is for.
HCAI: hospital financial signals
HCAI publishes quarterly hospital data. The page at hcai.ca.gov/data/cost-transparency/hospital-financials/ lists datasets with their coverage periods. Hospital financial data shifts track which counties are seeing capacity strain, charity-care growth, or service-line shutdowns: early signals of how the local healthcare safety net is absorbing pressure.
Extraction approach: Load the page, find text patterns like “Data through [date]” or “Last updated [date]” in the accessibility tree.
DHCS: Medi-Cal enrollment as a real-time labor-market signal
DHCS data lives on the California Health and Human Services Open Data Portal at data.chhs.ca.gov. Monthly Medi-Cal enrollment is one of the closest things California has to a real-time household-income signal. Enrollment moves when paychecks disappear, when seasonal work ends, and when household composition changes. A month-over-month spike in a given county is a leading indicator that something happened in that county’s labor market.
Extraction approach: Navigate to the specific dataset page, extract the “Modified” date from the metadata section.
State Controller: county fiscal capacity
The State Controller publishes county financial data at bythenumbers.sco.ca.gov and at the agency’s annual reports page (sco.ca.gov/ard_locrep_counties.html). The fiscal year appears in dataset titles: “Counties Annual Report FY 2023-24.” County expenditure patterns reveal which jurisdictions are absorbing safety-net costs, which are running structural deficits, and where staffing capacity for benefits administration is shifting.
Extraction approach: Load the page, find fiscal year references in dataset titles.
DOF: population estimates as a denominator
DOF publishes E-4 population estimates with the year in the filename and page title: “E-4 Population Estimates for 2025.” Population estimates are the denominator under almost every per-capita rate we calculate. When migration patterns shift (out-of-state moves, in-state county-to-county moves), every other rate has to be recalculated against the new base.
Extraction approach: Load the estimates page, extract the year from the title or file links.
EDD: county-level labor displacement
EDD publishes monthly employment data at labormarketinfo.edd.ca.gov. The reference month appears in data tables and page headers; as of late April 2026, the most recent release was for January 2026. Sub-state unemployment claims and labor force changes are where AI-exposed occupational shifts would land first, if they were going to land. The Anthropic Index tells us which occupations use AI; EDD county-level data tells us where employment in those occupations is changing.
Extraction approach: Load the employment page, extract the reference month from table headers or page content.
The check process
When invoked, the skill runs through this sequence:
For each source in tracking file:
  1. Load the source URL with Agent Browser
  2. Extract update indicators from page content
  3. Compare against last_known_update
  4. If different:
     - Flag as new data
     - Store new value
  5. Update last_checked timestamp
  6. Continue to next source
The output groups sources by status:
CA Data Watch: 2026-04-25

[HCAI] Healthcare Access and Information
  Status: No new updates
  Last known: 2025-Q4

[DHCS] Medi-Cal Data
  Status: NEW DATA DETECTED
  Last known: February 2026
  Current: March 2026

[SCO] State Controller
  Status: Annual update expected February
  Last known: FY 2023-24

Summary: 1 new update, 3 unchanged, 1 pending
Handling update schedules
Some sources follow predictable schedules. The State Controller releases annual data in February. DOF publishes population estimates in May. The skill flags when an expected update is approaching:
{
  "sco": {
    "update_frequency": "annual",
    "expected_update_month": 2
  }
}
In February, the check for SCO might show:
[SCO] State Controller
  Status: Annual update expected this month
  Last known: FY 2023-24
This prompts closer attention during the expected release window.
Error handling
Government websites occasionally go down for maintenance, change their structure, or add aggressive bot protection. Each of these is a maintenance event for the tracking infrastructure that the skill handles gracefully:
- Page load failure: Log the error, mark as “Check failed,” continue with other sources
- Structure change: If expected patterns are not found, mark as “Manual check needed”
- Cloudflare protection: Use headed mode, add delays, accept occasional CAPTCHA interruptions
The goal is degrading gracefully rather than failing completely. One problematic source should not block checking the others.
Report generation
For weekly research reviews, the --report flag generates a markdown file:
# CA Data Watch Report

**Date:** 2026-04-25
**Sources Checked:** 5
**New Updates:** 1

## Summary

| Source | Status | Last Known | Current |
|--------|--------|------------|---------|
| HCAI | Current | 2025-Q4 | 2025-Q4 |
| DHCS | New | Feb 2026 | Mar 2026 |

## New data available

### DHCS Medi-Cal enrollment (March 2026)

New monthly enrollment figures now available.
URL: data.chhs.ca.gov/dataset/medi-cal-managed-care-enrollment-report
The report provides a record of data availability for project documentation. Run weekly for a year, the reports also become a primary source in their own right. They form a continuous record of when each portal updated, which itself reveals patterns about which agencies are reliable monthly publishers and which let releases slide.
Extending the source list
The tracking file makes adding new sources straightforward. Housing data, school district enrollment, Air Resources Board emissions, CDPH disease surveillance, county-level eviction filings: same pattern, different slice. Any portal where a researcher wants the slow data to function as a real-time signal source rather than as an archive.
What this changes about how we define AI impact
This changes the cadence at which the slow data can function as a signal feed. The manual workflow required remembering to check, knowing where to look, and recognizing when something was new. The automated workflow handles the mechanical parts.
Time savings are a side effect. What matters is catching a Medi-Cal release the week it happens, instead of months later when an analysis happens to need it: that is what allows a slow data system to function as a real-time signal source.
This is what the parallel infrastructure looks like at the smallest scale. One researcher, five portals, one skill. The same pattern extends already to food security tracking through CalFresh participation files (also on the CHHS open data portal), and outward to displaced-worker tracking through county-level claims data, and school-record signals on absenteeism that move when household income flows shift. Each portal is a slice. The infrastructure is the consolidation across portals and across cadences.
The Anthropic Economic Index tells us what shows up in the telemetry. The slow data systems tell us what shows up in households. Both are necessary, and neither is sufficient on its own. AI’s role in research, increasingly, is helping us read the second category at the cadence at which the first category already reports.
Suggested Citation
Cholette, V. (2026, May 20). What AI impact looks like in the slow data. Too Early To Say. https://tooearlytosay.com/research/methodology/ai-impact-slow-data-parallel-infrastructure/