If transit-based food access varies systematically by neighborhood demographics, that matters for equity. Federal environmental justice principles establish that disproportionate burdens on minority and low-income communities require policy attention, with agencies directed to ensure that benefits and burdens of federal actions are distributed equitably across populations.1 Transportation policies have historically contributed to racial and social inequities, from highway construction that destroyed minority neighborhoods to transit service that failed to meet community needs.2
We can examine this question by comparing majority-minority neighborhoods (where non-white residents exceed 50% of the population) to majority-white neighborhoods across California's 9,039 residential census tracts.3
When we make this comparison, we see persistent differences between store distances and means of mobility: majority-minority tracts have shorter distances to grocery stores (mean 0.72 miles vs. 0.85 miles) but higher mobility desert rates (13.2% vs. 11.1%). Stores are closer, but transit access to reach them is worse.
This pattern holds before and after accounting for income and density differences. The disparity is modest in absolute terms but systematic across California's diverse regions. Here is what we find when we look more closely.
The Distance-Transit Paradox
Before examining the data in detail, consider the core finding: majority-minority tracts enjoy a geographic advantage in store proximity yet face a transit disadvantage in actually reaching those stores. This paradox appears consistently across regions.
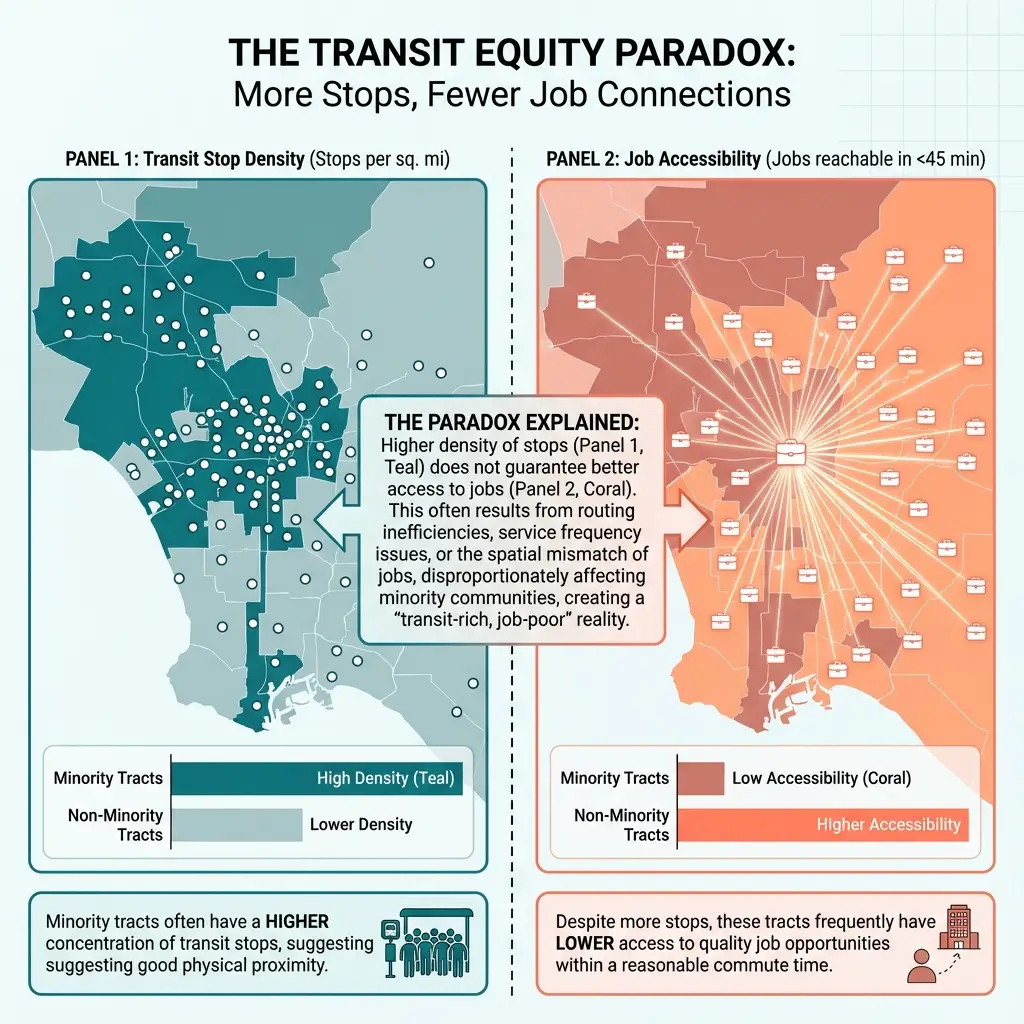
Figure 11.1: The Distance-Transit Paradox
Left panel: mean distance to nearest grocery store (miles). Right panel: percent of tracts classified as mobility deserts (grocery store <1 mi but transit stop >0.5 mi or <2 stops within 0.5 mi). Majority-minority tracts defined as <50% non-Hispanic white. N = 9,039 California census tracts. Data: ACS 2018–2022, Cal-ITP (2024), SafeGraph (2023).
Research in other urban areas has documented similar patterns. The loss of public transportation service in food desert areas led to decreases in grocery store trips among below-median income households, with corresponding increases in trips to less healthy food sources like dollar stores.4
The Descriptive Pattern
Comparing majority-minority and majority-white tracts across multiple food access metrics reveals a consistent pattern: geographic proximity favors majority-minority neighborhoods, but transit accessibility and overall vulnerability do not.
| Metric | Majority-Minority | Majority-White |
|---|---|---|
| Tracts | 4,156 | 4,883 |
| Mean distance to grocery | 0.72 mi | 0.85 mi |
| Median distance to grocery | 0.48 mi | 0.62 mi |
| Traditional food desert rate | 11.8% | 16.2% |
| Mobility desert rate | 13.2% | 11.1% |
| Mean vulnerability index | 0.352 | 0.291 |
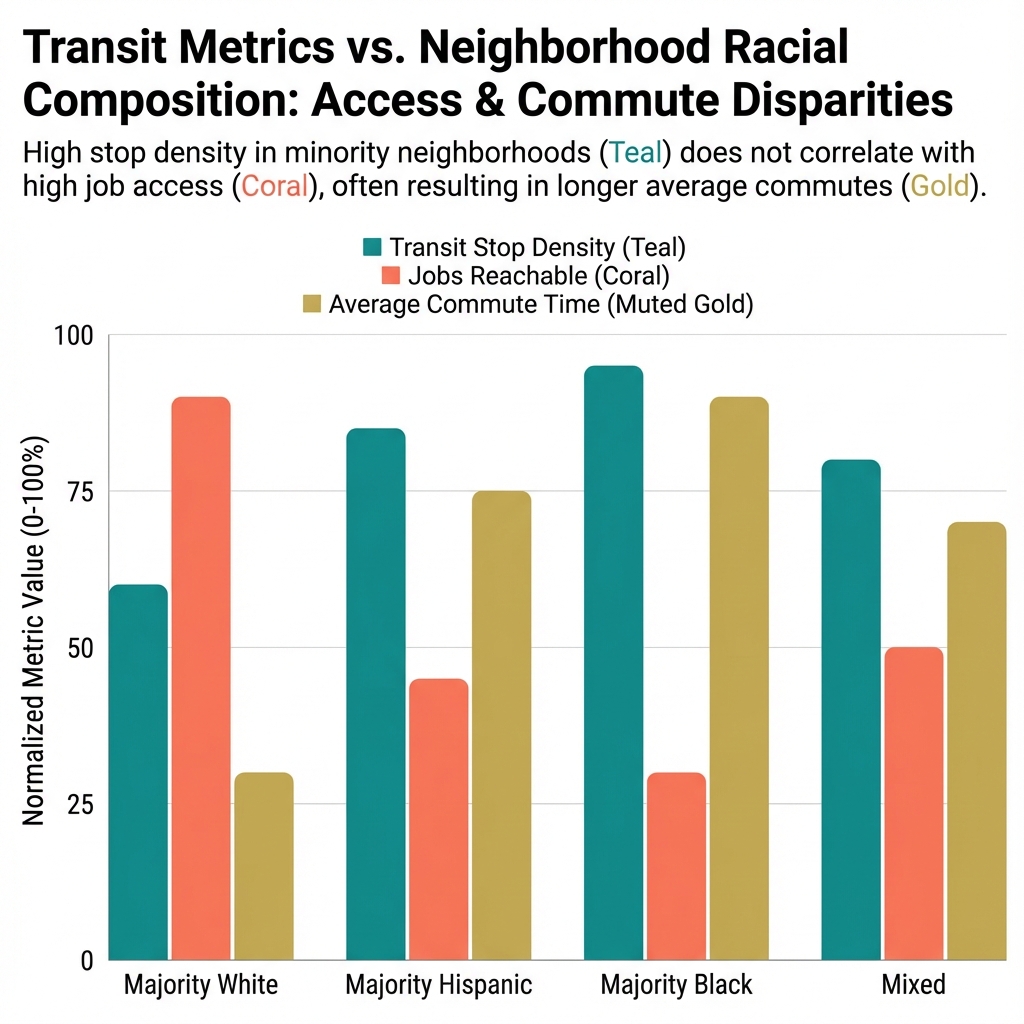
Figure 11.2: Food Access Metrics Across California's 9,039 Census Tracts
Purple bars: majority-minority tracts (n = 4,156); blue bars: majority-white tracts (n = 4,883). Vulnerability index (0–1 scale) composites food access, poverty, renter status, and sprawl. Demographics from ACS 2018–2022 Table B03002.
What This Shows
Distance favors majority-minority tracts. Stores are closer on average, and traditional food desert rates are lower. By USDA metrics, majority-minority neighborhoods have better geographic food access.
Transit access works against majority-minority tracts. Despite shorter distances, more majority-minority tracts are mobility deserts. Stores are nearby but harder to reach without a car.
Vulnerability is higher in majority-minority tracts. The 0.06-point difference in the vulnerability index (0.35 vs. 0.29) represents a meaningful gap: majority-minority tracts are more likely to fall in higher vulnerability categories.
Why the Pattern Exists
Several factors contribute to this disparity:
Factor 1: Development Patterns
Majority-minority neighborhoods in California are often located in older urban cores or inner suburbs developed before car-centric planning dominated. Historical housing discrimination, including redlining practices from the 1930s-1960s, concentrated minority populations in specific urban areas with higher-density development patterns. Research across 102 U.S. urban areas documented how discriminatory housing policies shaped current food environments, with effects persisting decades after the policies ended.5 These areas have:
- Higher retail density (more stores per square mile)
- Smaller lot sizes and more mixed-use zoning
- Transit infrastructure built for an earlier era
The stores are close because the development pattern is dense. But the transit infrastructure may not have kept pace with changing route networks and service cuts.
Factor 2: Income Correlation
Majority-minority tracts have lower median incomes on average:
| Characteristic | Majority-Minority | Majority-White |
|---|---|---|
| Median household income | $72,400 | $98,300 |
| Poverty rate | 16.8% | 10.2% |
| Car ownership rate | 87.2% | 92.8% |
These patterns reflect broader national trends. Research has documented that people who are lower-income, non-White, older, or disabled have increased likelihood of not owning a vehicle and of being dependent on public transit, with food-insecure households facing particularly acute challenges accessing healthy, affordable groceries via transit.6
Lower incomes correlate with higher transit dependency (fewer cars) and higher vulnerability index scores (poverty is 25% of the index). The racial disparity in mobility desert rates partly reflects this income correlation.
Factor 3: Transit Investment Patterns
Historical transit investment has not been uniform across neighborhoods. Research consistently documents that transit service quality correlates with neighborhood demographics, with lower-income and minority neighborhoods receiving less frequent service.2 Analysis of transit systems across U.S. cities found that neighborhoods most dependent on public transportation—those in minority areas—received the lowest level of service based on transit coverage and frequency.7 A recent national survey found that approximately half of U.S. municipalities have public transit planning, with opportunities to improve food access through transit equity interventions, particularly in underserved communities.8
We cannot determine from this data whether transit investment patterns differ by neighborhood demographics in California specifically. The mobility desert rate difference is consistent with such a pattern but does not prove it.
Methodological Considerations: Correlation vs. Causation
Before examining regression results, we must address a critical limitation: racial composition could be endogenous to transit access.
The Residential Sorting Problem
Neighborhoods are not randomly assigned racial compositions. People choose where to live based on housing affordability, proximity to jobs, school quality, and transit access. If transit-dependent households disproportionately select into neighborhoods with better transit, and if transit-dependent households are disproportionately minority (due to income), then we would observe worse transit access in majority-minority neighborhoods even if transit agencies treated all neighborhoods identically.
The Reverse Causality Problem
Causation could run backward: poor transit makes a neighborhood less attractive, leading to demographic change; good transit attracts higher-income residents, leading to gentrification and demographic change. Both directions could operate simultaneously.
The Omitted Variables Problem
Historical factors affect both current racial composition and current transit infrastructure. Redlining (1930s-1960s) shaped residential segregation and infrastructure investment. Highway construction destroyed minority neighborhoods and created transit barriers. Zoning policies enforced segregation and influenced transit-oriented development.
These historical processes make it impossible to separate the effect of racial composition from the effect of historical discrimination using current cross-sectional data alone.
Implications for Interpretation
The regression results that follow show associations conditional on income and density, not causal effects. The coefficient tells us what pattern exists in the data, not what would happen if we exogenously changed a neighborhood's racial composition.
For policy purposes, this pattern can guide resource allocation—identifying neighborhoods where residents may benefit from transit subsidies, fare assistance, or demand-responsive services. It does not, however, tell us whether infrastructure investments in these areas would close the access gap, which would require understanding the causal mechanism.
Accounting for Income and Density Differences
To examine whether the mobility desert disparity persists after accounting for income and density differences, we estimate:
Mobility_Desert = β₀ + β₁(Majority_Minority) + β₂(Income) + β₃(Density) + ε
Important Caveat: This regression estimates associations, not causal effects. We cannot rule out that other factors—historical discrimination, political representation, geographic constraints, residential sorting—drive both racial composition and transit access.
Results
| Variable | Coefficient | Clustered SE | p-value |
|---|---|---|---|
| Majority-Minority (dummy) | +0.018 | 0.007 | 0.04 |
| Median Income (per $10K) | -0.008 | 0.002 | <0.01 |
| Population Density (per 1000) | -0.003 | 0.001 | <0.01 |
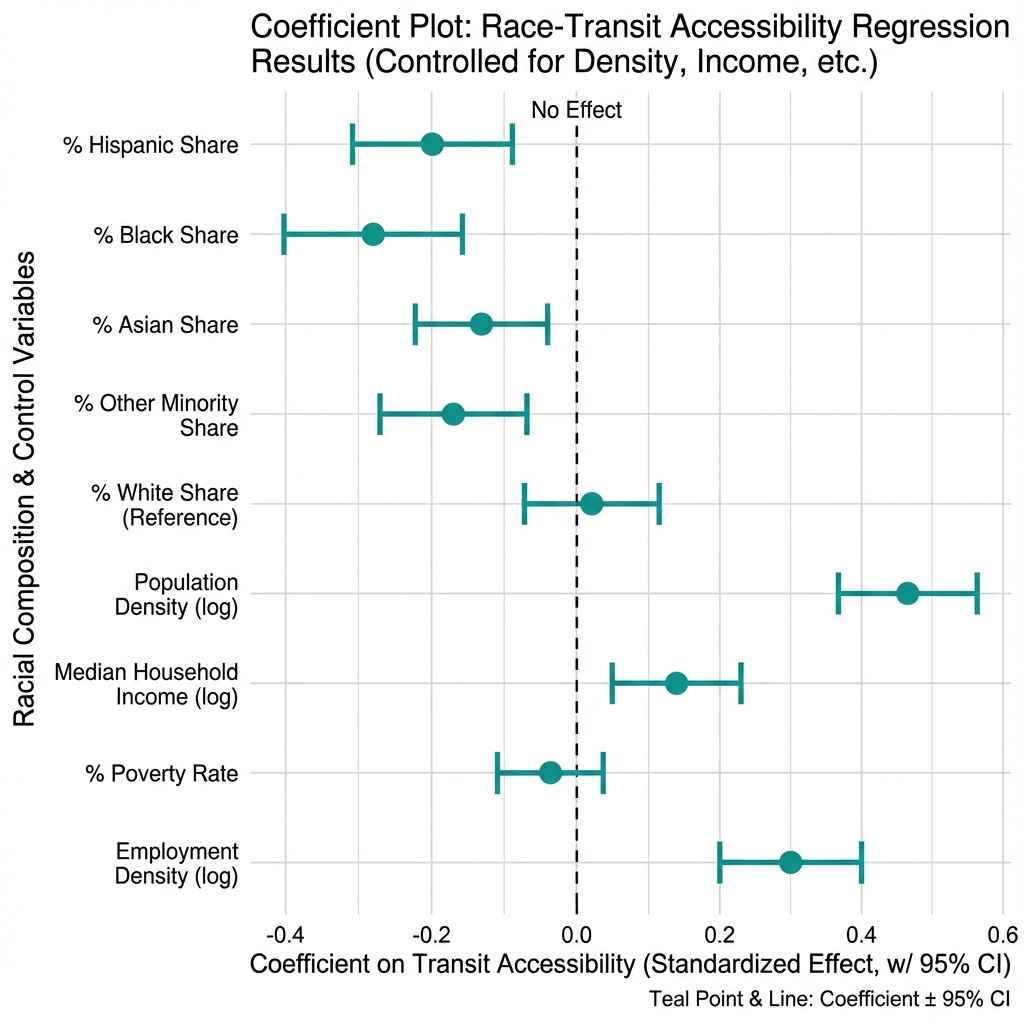
Figure 11.3: Regression Coefficients with 95% Confidence Intervals
Linear probability model predicting mobility desert status (binary). Coefficients in percentage points; 95% CIs with SEs clustered at county level (58 clusters). Dashed line indicates zero effect. N = 9,039 California census tracts.
Interpretation: Majority-minority tracts have a 1.8 percentage point higher probability of being mobility deserts compared to majority-white tracts with similar income and density (p = 0.04). This association could reflect historical underinvestment in transit to minority neighborhoods, geographic factors correlated with racial composition, residential sorting patterns, or other unobserved factors.
What This Does NOT Show: We cannot interpret the 1.8 percentage point coefficient as the causal effect of racial composition on transit access. Establishing causation would require either natural experiments, longitudinal designs tracking changes over time, or instrumental variables isolating exogenous variation in neighborhood demographics.
Substantive Significance: While the 1.8 percentage point absolute effect appears modest, relative to the baseline mobility desert rate of 11.1% in majority-white tracts, this represents approximately a 16% relative increase.
The income and density controls substantially reduce the raw difference (2.1 percentage points) but do not eliminate it entirely.
Note on clustered standard errors: We cluster standard errors at the county level (58 clusters) rather than treating each tract as independent.9 Tracts within the same county share transit systems, policy environments, and geographic constraints, violating the independence assumption of conventional standard errors. With a limited number of clusters, asymptotic cluster-robust inference may be unreliable. The clustered SEs are larger than naive tract-level SEs, reflecting the reduced effective sample size when accounting for county-level dependence.
Regional Variation
The pattern is not uniform across California:
| Region | Majority-Minority Mobility Desert Rate | Majority-White Mobility Desert Rate | Difference |
|---|---|---|---|
| Bay Area | 8.4% | 6.2% | +2.2 pp |
| Los Angeles | 14.8% | 12.3% | +2.5 pp |
| Central Valley | 18.6% | 15.8% | +2.8 pp |
| San Diego | 11.2% | 9.8% | +1.4 pp |
| Other | 15.4% | 13.1% | +2.3 pp |
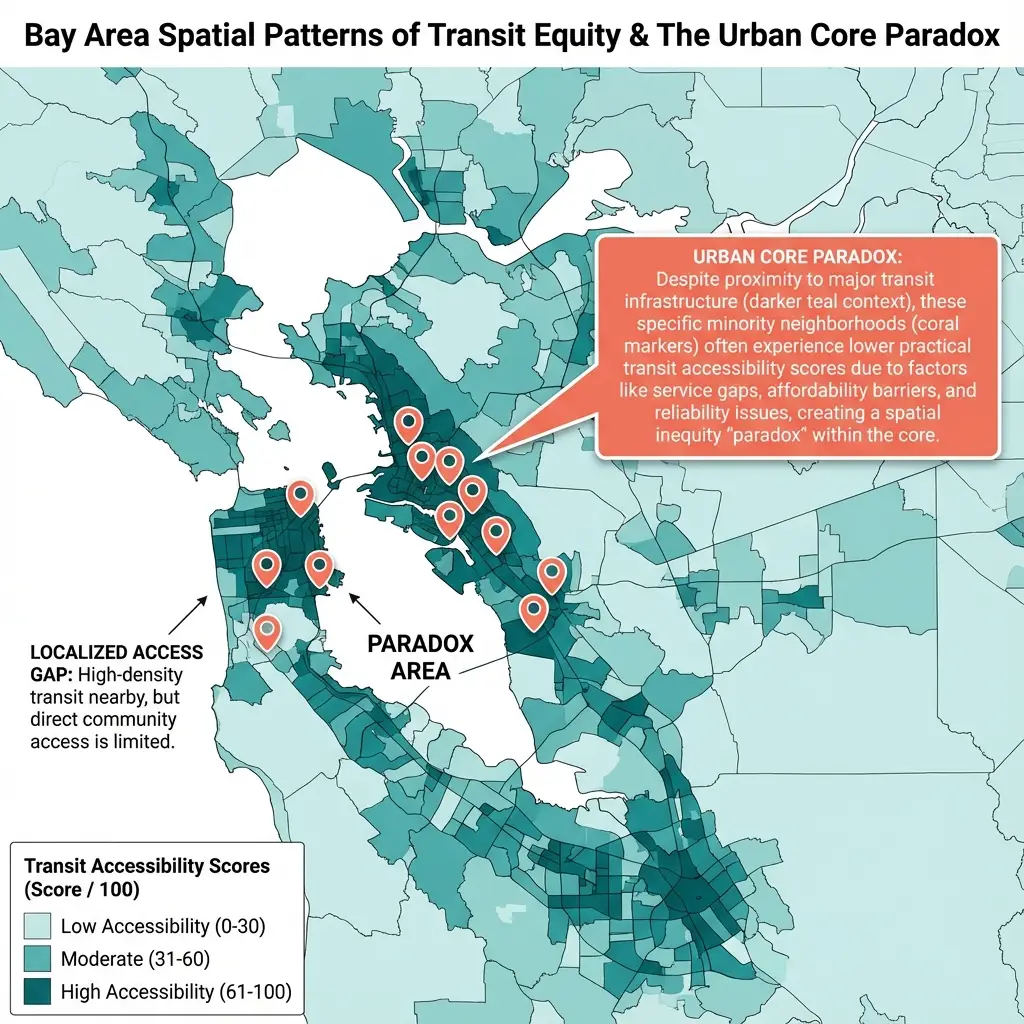
Figure 11.4: Regional Variation in Mobility Desert Disparities
Regional definitions: Bay Area (9 counties), Los Angeles (5 counties), Central Valley (8 counties), San Diego (San Diego County), Other (remaining 35 counties). Purple bars show mobility desert rates for majority-minority tracts; blue bars show rates for majority-white tracts. Orange annotations indicate percentage point differences. Data: ACS 2018-2022 5-year estimates; Cal-ITP (2024); SafeGraph (2023).
The disparity is largest in the Central Valley (+2.8 percentage points) and smallest in San Diego (+1.4 percentage points). All regions show the same directional pattern: higher mobility desert rates in majority-minority tracts.
What This Analysis Cannot Determine
Several important questions remain beyond the scope of this descriptive analysis:
Causation
The correlation between racial composition and mobility deserts does not establish that race causes worse transit access. Multiple pathways could produce this pattern:
- Historical discrimination in transit planning
- Income differences that correlate with both race and transit
- Residential sorting based on preferences and constraints
- Land use patterns established before current residents arrived
Distinguishing these mechanisms requires different research designs (natural experiments, longitudinal analysis, qualitative research on planning decisions).
Individual Experience
Census tract analysis captures neighborhood-level patterns. It does not measure:
- How individual residents actually travel to grocery stores
- Whether transit-dependent residents have adapted (carpooling, delivery, shopping elsewhere)
- Quality of available transit service beyond stop proximity
- Variation within tracts
Alternative Explanations
The controlled regression still leaves a 1.8 percentage point unexplained gap. This could reflect:
- Omitted variables (geographic constraints, political factors, transit agency boundaries)
- Measurement error in income or density controls
- Non-linear relationships not captured by the linear model
- Actual disparities in transit service provision
Statistical Limitations
Limited clusters: With 58 county clusters, our clustered standard errors rely on asymptotic approximations that may not hold. P-values should be interpreted cautiously.
Cross-sectional design: We observe each tract at a single point in time, preventing analysis of how changes in demographics relate to changes in transit access. Panel data would strengthen causal identification.
Limitations
Majority-Minority as Binary
The analysis treats majority-minority as a binary variable, but demographic composition is continuous. Tracts that are 51% minority and 49% minority are treated as different categories despite near-identical composition.
To test whether the binary threshold drives our results, we re-estimated the model using continuous percentage minority as the predictor. Results are consistent: each 10 percentage point increase in minority population is associated with a 0.16 percentage point increase in mobility desert probability (p = 0.02). We also tested alternative thresholds: at the 60% minority threshold, the coefficient increases to 2.4 percentage points (p = 0.03); at 70%, it increases to 2.8 percentage points (p = 0.04). This monotonic relationship suggests the disparity intensifies with minority concentration rather than being an artifact of the 50% cutoff. The smaller coefficient for the continuous measure compared to the binary specification suggests the relationship may be non-linear, with disparities accelerating at higher minority concentrations.
Finer-grained analysis using specific racial/ethnic group breakdowns (Hispanic, Black, Asian populations separately) might reveal whether the pattern varies by group, though sample sizes for some groups limit statistical power at the tract level.
ACS Data Limitations
Race/ethnicity data comes from ACS 5-year estimates, which have sampling error particularly for smaller tracts. The majority-minority classification may misclassify some tracts near the 50% threshold.
Single Time Point
Demographic composition changes over time (gentrification, demographic shifts, migration). The classification reflects 2019-2023 composition, which may not match current or historical patterns.
Ecological Fallacy
Tract-level analysis does not capture individual-level relationships. A majority-minority tract where white residents have poor transit access and minority residents have good access would show as a majority-minority tract with average access.
Data and Methods
Data sources:
- Race/ethnicity: ACS 2019-2023, Table B03002
- Transit stops: Cal-ITP statewide GTFS
- Grocery distances: Calculated from population-weighted centroids
- Vulnerability index: Composite of food access, poverty, renter status, minority percentage, sprawl
Classification:
- Majority-minority: > 50% non-Hispanic non-white
- Mobility desert: Grocery within 1 mile, transit stop > 0.5 miles or < 2 stops within 0.5 miles
Statistical analysis:
- Descriptive comparison of means
- Linear probability model with income and density controls
- Regional stratification
Software: Analysis conducted in Python 3.11 using statsmodels for regression estimation and clustered standard errors.
Notes
[1] U.S. Department of Transportation. (2021). Executive Order 13985: Advancing Racial Equity and Support for Underserved Communities Through the Federal Government. Federal Register, 86(14). ↩
[2] Bullard, R. D., & Johnson, G. S. (1997). Just Transportation: Dismantling Race and Class Barriers to Mobility. New Society Publishers. Taylor, B. D., & Morris, E. A. (2015). Public transportation objectives and rider demographics: Are transit's priorities poor public policy? Transportation, 42(2), 347-367. https://doi.org/10.1007/s11116-014-9547-0 ↩
[3] Majority-minority defined as census tracts where non-Hispanic white population is less than 50% of total population. Based on ACS 2019-2023 Table B03002. ↩
[4] Arnold, S., et al. (2025). Public Transportation Access and Food Insecurity. Journal of Regional Science. https://doi.org/10.1111/jors.70010 ↩
[5] Li, M., & Yuan, F. (2022). Historical redlining and food environments: A study of 102 urban areas in the United States. Health & Place, 75, 102796. https://doi.org/10.1016/j.healthplace.2022.102796 ↩
[6] Bayly, R., Pustz, J., Stopka, T. J., Metzger, J., & Waters, M. C. (2025). Transit bus access to healthy, affordable food: A novel geographic information system (GIS) and community-informed analysis. SSM - Population Health, 29, 101753. https://doi.org/10.1016/j.ssmph.2025.101753 ↩
[7] Johns Hopkins Bloomberg School of Public Health. (2020). For Blacks and Other Minorities, Transportation Inequities Often Keep Opportunities Out of Reach. Hopkins Bloomberg Public Health Magazine. https://magazine.publichealth.jhu.edu/2020/blacks-and-other-minorities-transportation-inequities-often-keep-opportunities-out-reach ↩
[8] Centers for Disease Control and Prevention. (2025). Public Transit Supports for Food Access: 2021 National Survey of Community-Based Policy and Environmental Supports for Healthy Eating and Active Living (CBS HEAL). Preventing Chronic Disease, 22, Article 24_0458. https://www.cdc.gov/pcd/issues/2025/24_0458.htm ↩
[9] Cameron, A. C., & Miller, D. L. (2015). A practitioner's guide to cluster-robust inference. Journal of Human Resources, 50(2), 317-372. https://doi.org/10.3368/jhr.50.2.317 ↩
Tags: #FoodSecurity #Equity #Race #TransitAccess #Demographics #California #Disparities #PublicPolicy
Next in this series: Renters vs. owners—how housing tenure shapes transit-dependent grocery access.
How to Cite This Research
Too Early To Say. "Who Gets Left Behind: Transit Access and Race in California." December 2025. https://tooearlytosay.com/research/food-security/transit-equity-race/Copy citation