Federal food access policy operates on a simple assumption: if a grocery store is within a mile of your home, you have food access.[1] Over $500 million in annual USDA funding flows to areas that fail this distance test.[2] But what happens to neighborhoods where stores are nearby on paper but practically unreachable without a car?
We can explore this question by looking at transit infrastructure alongside grocery locations. When we combine statewide transit data with store locations across California's 9,039 residential census tracts, we find 1,086 neighborhoods where the federal distance test says access is fine, but transit-dependent residents face genuine barriers. That's 12% of California neighborhoods invisible to distance-based policy.
When we examine these "mobility deserts," we see a systematic pattern: stores exist nearby, but the transit infrastructure to reach them doesn't. This suggests that for roughly one in eight California neighborhoods, the policy response of building new stores may not address the primary barrier. In these neighborhoods, the distance to retail is not the limiting factor; the limiting factor is transit infrastructure.
The Scale of the Problem
To understand the scope, we need transit stop locations from all agencies serving the state, not just major regional systems. California's Cal-ITP system aggregates stops from over 200 agencies into a single dataset, including municipal bus systems that serve suburban areas often missed by regional agency data.[3] When we use this data (64,060 unique transit stops) to classify every residential census tract, here's what we see:
| Classification | Tracts | Percentage |
|---|---|---|
| Full Access | 5,443 | 60.2% |
| Traditional Food Desert | 2,510 | 27.8% |
| Mobility Desert | 1,086 | 12.0% |
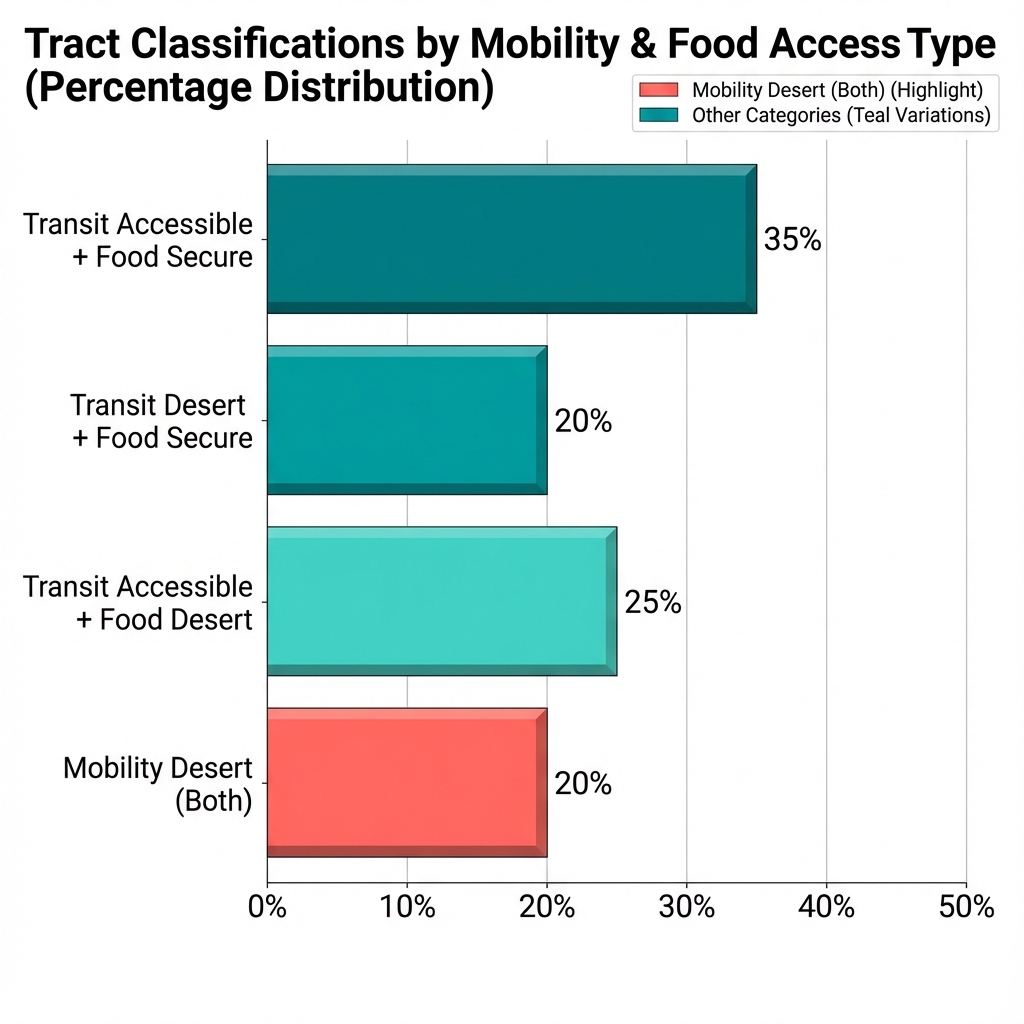
Full Access means a grocery store within 1 mile AND a transit stop within 0.5 miles with at least 2 stops nearby. These neighborhoods work for both drivers and transit users.
Traditional Food Desert means the nearest grocery store is more than 1 mile away. These are the neighborhoods federal metrics already flag.
Mobility Desert means a grocery store exists within 1 mile, but transit access is poor: either no stop within 0.5 miles, or fewer than 2 stops nearby. These neighborhoods look fine on federal maps but fail transit-dependent residents.
What this tells us: 1,086 tracts represent a hidden population where building new grocery stores won't help because stores already exist nearby. The barrier isn't retail location. It's transit infrastructure.
Who Lives in Mobility Deserts
Approximately 5 million Californians live in mobility desert tracts. But not all of them face this barrier; only residents without reliable car access depend on transit to reach grocery stores.
When we look at the demographics of mobility desert tracts, a pattern emerges: these are disproportionately suburban and exurban areas with lower poverty rates (9.4% vs. 12% statewide) and lower renter rates (33% vs. 45% statewide). Both characteristics correlate with higher vehicle ownership. Where California overall has about 7.5% of households without a vehicle, mobility desert tracts likely have rates closer to 3-5%.
That translates to roughly 150,000-250,000 transit-dependent residents facing this specific barrier: people who live near grocery stores they cannot easily reach.
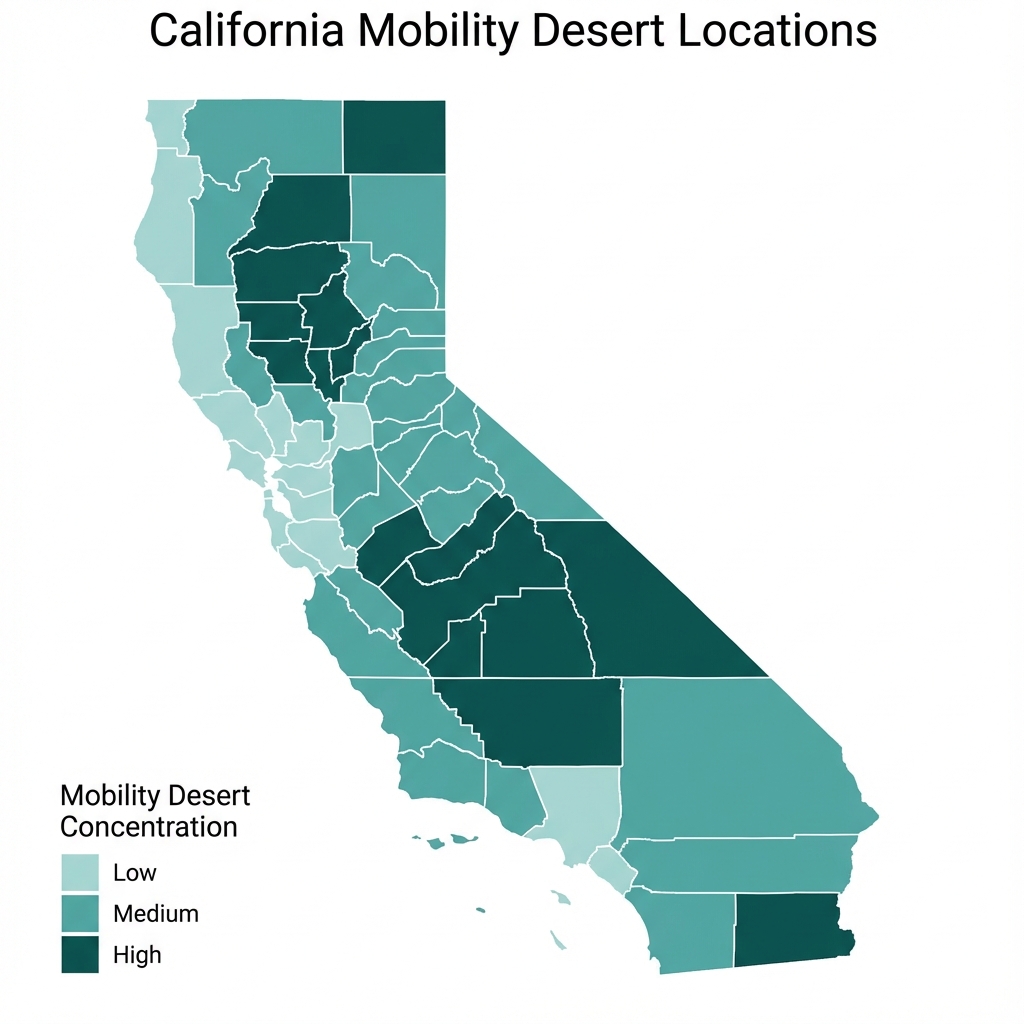
Geographically, mobility deserts cluster in specific regions:
| Region | Mobility Desert Tracts |
|---|---|
| Los Angeles metro | 412 |
| San Diego | 216 |
| Bay Area | 129 |
| Central Valley | 128 |
| Sacramento | 121 |
| Other regions | 80 |
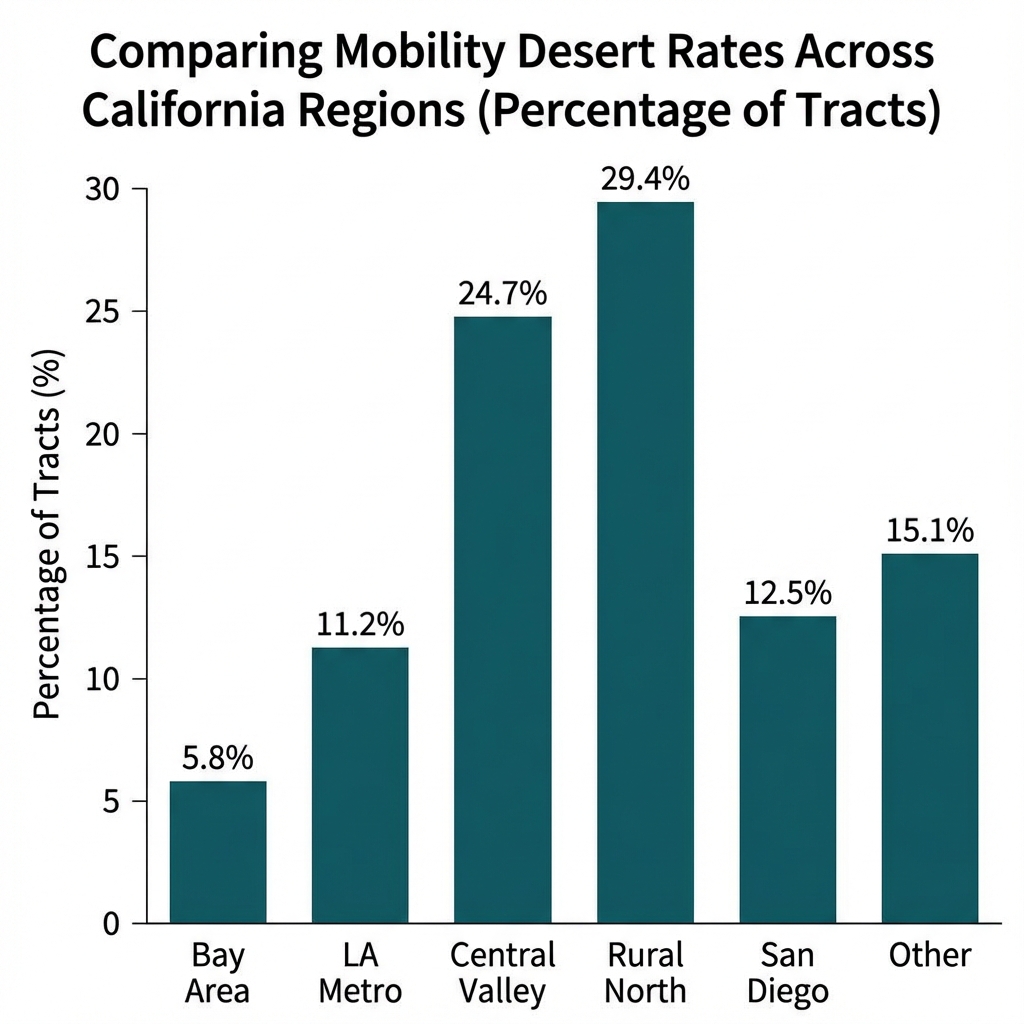
The LA metro and San Diego concentrations reflect sprawling suburban development patterns where residential areas outpaced transit infrastructure. The Bay Area's 129 tracts tend to be in outer suburbs beyond BART and major bus networks.
What Defines a Mobility Desert
A census tract qualifies as a mobility desert when three conditions hold:
- Grocery store within 1 mile: The tract is not a traditional food desert
- No transit stop within 0.5 miles: OR fewer than 2 stops within 0.5 miles
- Residential population: Minimum density and population thresholds met
The 0.5-mile threshold aligns with transportation planning standards for acceptable walking distance to transit.[4] The requirement for 2+ stops reflects that a single stop with infrequent service doesn't provide reliable access.
The Classification Logic
If grocery distance > 1 mile:
    → Traditional Food Desert

Else if transit stop > 0.5 miles OR stops within 0.5 miles < 2:
    → Mobility Desert

Else:
    → Full Access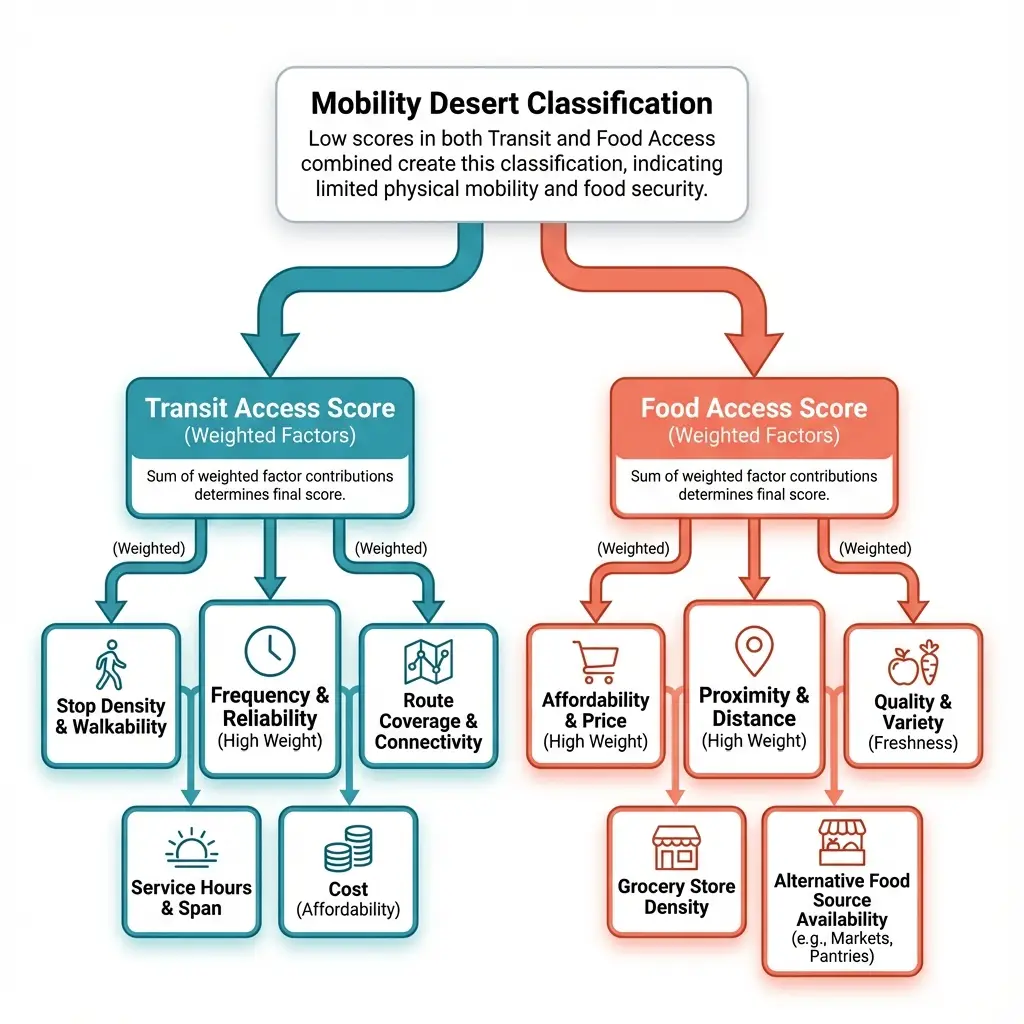
This definition is conservative. It only flags tracts where both conditions hold: stores are nearby but transit is inadequate.
Statewide Transit Accessibility
It's worth looking at California's overall transit picture before focusing on mobility deserts. When we examine the Cal-ITP data:
| Metric | Value |
|---|---|
| Mean distance to nearest transit stop | 0.88 miles |
| Median distance to nearest stop | 0.24 miles |
| Tracts with stop within 0.5 miles | 72.9% |
What we see: nearly three-quarters of residential census tracts have a transit stop within half a mile. But this aggregate number masks substantial variation. In dense urban cores, stops average under 0.1 miles away. In sprawling suburbs and rural areas, the nearest stop can be several miles distant.
Why This Matters for Policy
The mobility desert concept matters because it changes what interventions make sense:
For traditional food deserts: The policy response is often attracting new grocery retailers, subsidizing stores, or supporting mobile markets. Building supply where none exists.
For mobility deserts: Stores already exist nearby. Adding more won't help. The intervention targets are different: transit frequency improvements, route adjustments, demand-responsive service, or last-mile solutions.
To see why this matters, consider a tract where the nearest grocery store is 0.8 miles away but the nearest transit stop is 1.2 miles away. By USDA standards, this neighborhood has adequate food access. But for the 8-10% of California households without vehicles, the store presents a significant access barrier.[5]
What we're seeing is a systematic blind spot in federal measurement frameworks: federal food access metrics target areas where stores are distant. These metrics don't capture areas where stores are nearby but potentially inaccessible to transit-dependent residents.
A Note on Data Quality
The 12% mobility desert rate reported here comes from California's most complete transit dataset: Cal-ITP's statewide aggregation with 64,060 stops from 200+ agencies. An earlier analysis using incomplete data from 8 major agencies showed 49%, a dramatic overestimate that we caught during validation.[6]
The 4-fold difference came entirely from data completeness, not methodology. The lesson: transit accessibility research requires the most complete GTFS data available.
What This Analysis Cannot Determine
This analysis identifies neighborhoods where grocery stores are nearby but transit access is limited. However, several important questions cannot be answered with cross-sectional data:
- Causal effects of transit improvements: We cannot determine whether adding transit service would change grocery shopping behavior or food security outcomes.
- Why transit gaps exist: The analysis documents where transit-grocery mismatches occur but cannot determine the underlying causes.
- How affected residents cope: The data shows where the barrier exists but not how people navigate it.
- Household-level impacts: The classification uses census tract averages and cannot identify which specific households face actual barriers.
Data and Methods
Transit data: Cal-ITP GTFS Ingest Pipeline from data.ca.gov, capturing 143,203 transit stops from all California transit agencies. After filtering for valid California coordinates and deduplicating by location, 64,060 unique stops remained.
Grocery distances: Calculated for all California census tracts using residential population-weighted centroids and validated grocery store locations. Euclidean (straight-line) distance to nearest store.
Census tracts: 9,039 residential tracts meeting minimum population density (100 people/sq mi) and total population (500 residents) thresholds.
Classification thresholds:
- Grocery close: Within 1 mile
- Transit close: Stop within 0.5 miles
- Adequate transit: 2+ stops within 0.5 miles
Notes
[1] Analysis of 9,039 California census tracts with residential populations, November 2025. Transit data from Cal-ITP GTFS Ingest Pipeline (data.ca.gov). ↩
[2] Ver Ploeg, M., Dutko, P., & Breneman, V. (2015). "Measuring food access and food deserts for policy purposes." Applied Economic Perspectives and Policy, 37(2), 205-225. ↩
[3] Cal-ITP (California Integrated Travel Project). GTFS data acquired November 29, 2025 from data.ca.gov. ↩
[4] Federal Transit Administration. (2017). TOD Pilot Program Planning Guidance. U.S. Department of Transportation. ↩
[5] American Community Survey 2019-2023 estimates. ↩
[6] Previous analysis used GTFS data from 8 agencies. The 24,421 stops captured only a fraction of California's transit infrastructure. ↩
Tags: #FoodSecurity #TransitAccess #MobilityDeserts #California #SpatialAnalysis #PublicPolicy
Next in this series: How we calculated 2.7 million transit routes using free tools (r5py, GTFS, OpenStreetMap) at zero API cost.
How to Cite This Research
Too Early To Say. "Mobility Deserts: When Grocery Stores Are Close on Paper But Unreachable Without a Car." November 2025. https://tooearlytosay.com/research/transit-equity/hidden-mobility-deserts/Copy citation