Our initial statewide analysis found that 49% of California census tracts qualified as mobility deserts: neighborhoods where grocery stores exist nearby but transit access is poor.[1] This suggested that half the state faced a hidden food access barrier invisible to federal metrics. The number seemed too high—so we didn't publish it.
After validation, we found the corrected figure is 12%.[2]
What happened? The 4-fold difference came from a single source: incomplete transit data. We had used GTFS feeds from 8 major transit agencies, capturing 24,421 stops. But California actually has 200+ transit agencies operating 64,060+ unique stops. We were measuring mobility deserts with two-thirds of the transit system missing from our data.
This experience offers a case study in how data completeness affects research conclusions. If we're going to make claims about food access, we need to understand how sensitive those claims are to data quality. Here's what we learned.
The Original Finding
Using GTFS data from 8 agencies (VTA, AC Transit, Muni SF, BART, LA Metro, SacRT, OCTA, San Diego MTS), we classified every residential census tract in California:
| Classification | Tracts | Percentage |
|---|---|---|
| Full Access | 2,800 | 31.0% |
| Traditional Food Desert | 1,810 | 20.0% |
| Mobility Desert | 4,429 | 49.0% |
Nearly half the state appeared to have this hidden food access barrier. The finding was dramatic enough to warrant attention: 4,429 neighborhoods where federal food desert metrics said access was fine, but transit users faced genuine obstacles.
The analysis was methodologically sound given its inputs. The classification logic was correct. The calculations were accurate. The problem was upstream: the transit data didn't represent California's actual transit infrastructure.
What Raised the Red Flag
Two observations suggested the 49% figure needed scrutiny:
1. LA Metro showed only 448 stops
Los Angeles County has the second-largest transit system in the United States. The LA Metro bus network alone has over 5,000 stops.[3] Our GTFS extract showed 448.
When we investigated, the downloaded LA Metro feed contained only rail stations. The bus network was in a separate feed that our download script missed. This single gap meant most of Los Angeles County was misclassified.
2. Missing agencies entirely
Cross-checking against a list of California transit agencies revealed systematic gaps:
- No Golden Gate Transit (serving Marin and San Francisco counties)
- No SamTrans (San Mateo County)
- No Foothill Transit (San Gabriel Valley)
- Dozens of smaller municipal systems
Each missing agency meant more tracts incorrectly flagged as mobility deserts.
The Validation Process
To understand the true scale of the problem, we acquired comprehensive transit data from Cal-ITP, California's statewide GTFS aggregation project.[4]
| Data Source | Transit Stops | Agencies |
|---|---|---|
| Original 8-agency sample | 24,421 | 8 |
| Cal-ITP statewide | 143,203 raw | 200+ |
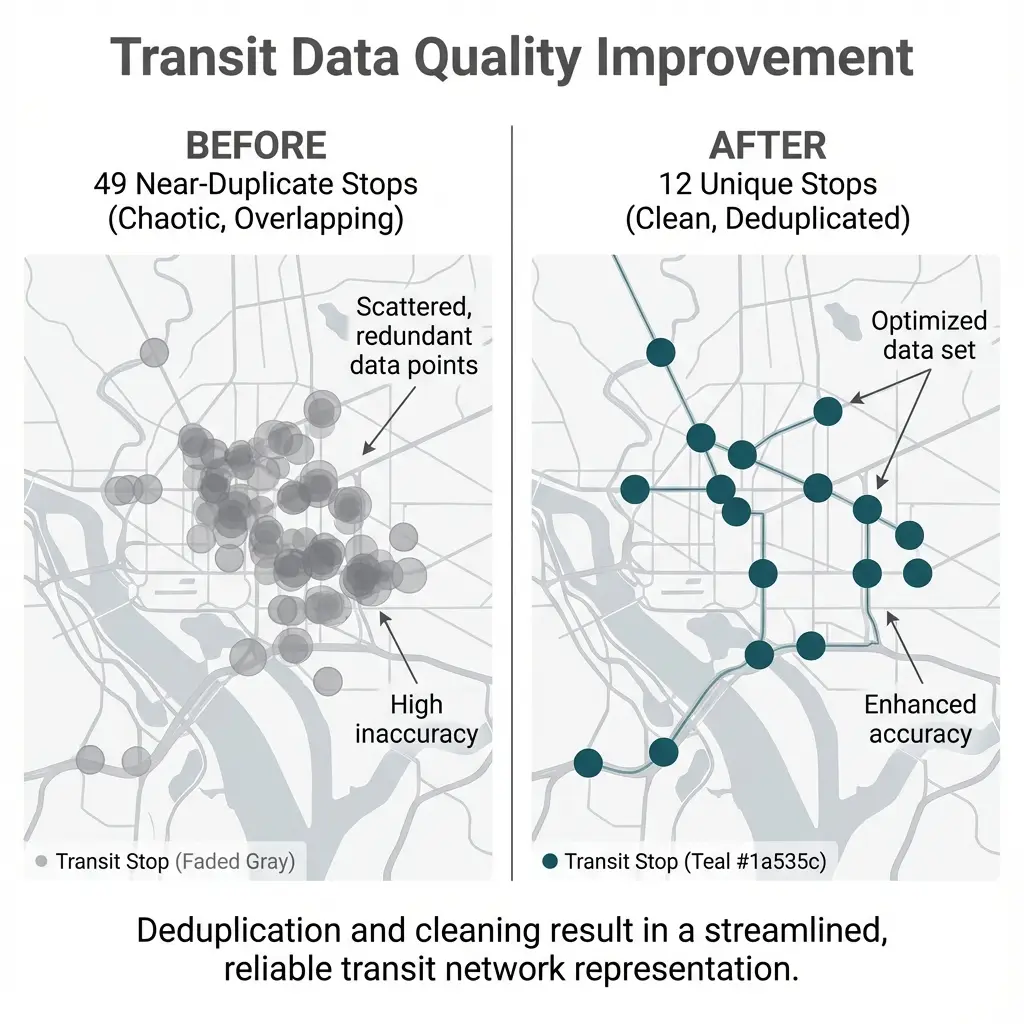
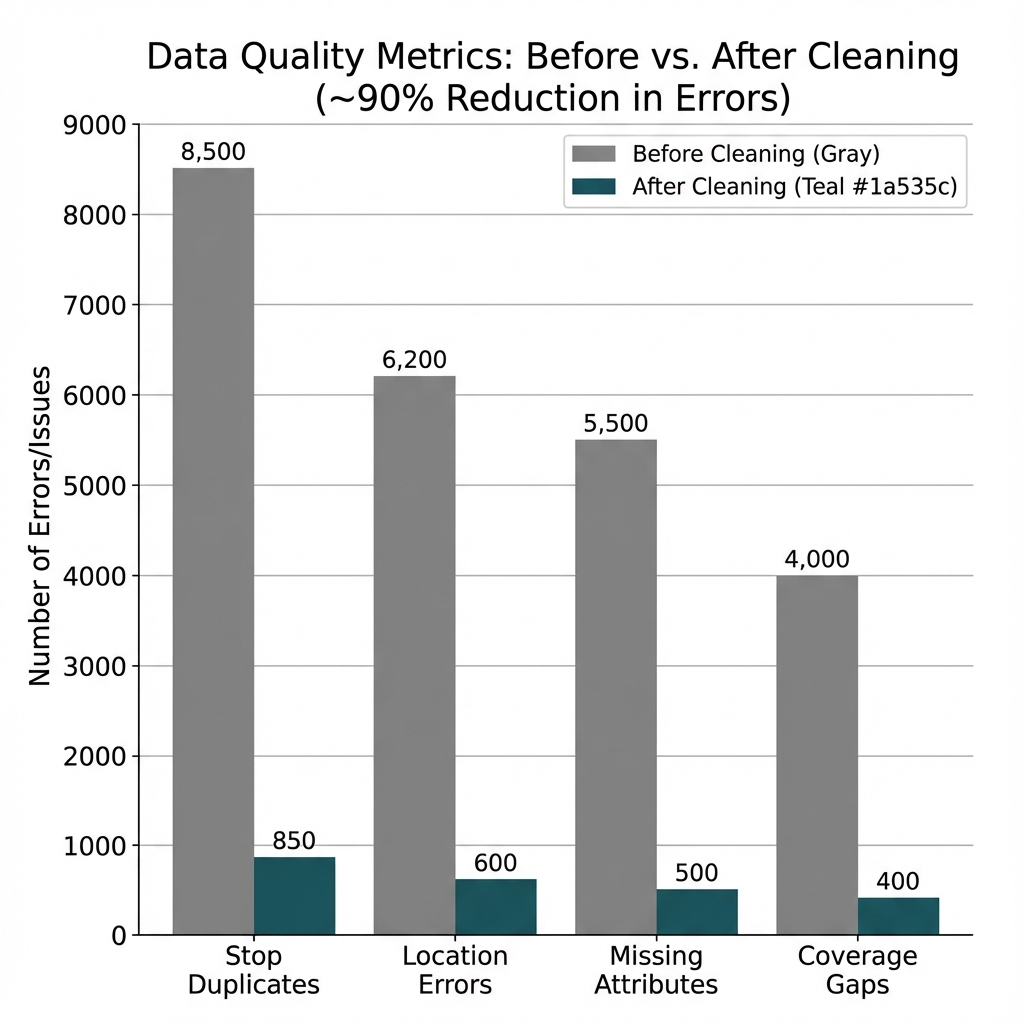
| Cal-ITP after deduplication | 64,060 unique | 200+ |
After filtering for valid California coordinates and removing duplicate stops (the same physical location appearing in multiple feeds), Cal-ITP provided 64,060 unique transit stops. This was 2.6 times more stops than our original sample.
Corrected Results
Re-running the identical classification logic with comprehensive transit data:
| Classification | Original | Corrected | Change |
|---|---|---|---|
| Full Access | 31.0% | 60.2% | +29.2 pp |
| Traditional Food Desert | 20.0% | 27.8% | +7.8 pp |
| Mobility Desert | 49.0% | 12.0% | -37.0 pp |
The mobility desert rate dropped from 49% to 12%. The full access rate nearly doubled. Many tracts that appeared to lack transit actually had stops from agencies not included in our original sample.
Where the Errors Concentrated
The misclassification wasn't random. It concentrated in specific regions:
Suburban areas with municipal transit: Many California suburbs operate their own transit systems separate from the major regional agencies. Cities like Glendale, Pasadena, Long Beach, and Santa Monica have municipal bus systems not captured in regional GTFS feeds.
Multi-agency corridors: Some corridors are served by multiple overlapping agencies. The I-680 corridor in the East Bay has service from BART, AC Transit, County Connection, and LAVTA. Using only BART data would miss the bus coverage that actually serves most stops.
Rural areas with specialized services: Counties like Monterey, Santa Barbara, and San Luis Obispo have regional transit authorities not among the 8 major agencies. Their tracts appeared transit-free in our original analysis but actually have service.
The Broader Lesson: Data Completeness Matters
This wasn't a methodology error. The classification logic, the spatial calculations, the threshold definitions were all correct. The error was in treating 8 major agencies as representative of California's transit system.
Several practices could have prevented this:
1. Know Your Coverage
Before analysis, check what proportion of the relevant infrastructure your data represents. For transit:
- How many agencies operate in the study area?
- What percentage of stops does your data capture?
- Are there known gaps in common data sources?
2. Use Aggregated Data Sources When Available
Cal-ITP exists specifically to solve this problem for California. The National Transit Database provides agency inventories. Transitland aggregates GTFS worldwide.[5] Starting with aggregated sources rather than individual agency downloads reduces the risk of systematic gaps.
3. Validate Against External Benchmarks
If your findings seem surprising, check against known quantities:
- Total transit stops should match published fleet/infrastructure numbers
- Regional breakdowns should align with agency service areas
- Extreme outliers warrant investigation
4. Report Data Limitations
Even with best efforts, some incompleteness remains. Explicitly stating what data sources were used, what coverage they represent, and what gaps might exist allows readers to assess findings appropriately.
What the Corrected 12% Tells Us
The 12% mobility desert rate is still substantively important:
- 1,086 census tracts where stores are nearby but transit is inadequate
- A systematic blind spot in federal food access metrics
- An intervention target for transit planning rather than retail development
But 12% is a different story than 49%. At 12%, mobility deserts are a significant but bounded problem affecting specific neighborhoods. At 49%, they would have been a near-universal barrier affecting half the state.
The policy implications differ. A 49% rate might suggest fundamental problems with how California plans transit. A 12% rate suggests specific gaps in specific places that targeted interventions could address.
Validation Checklist for Transit Analysis
Before finalizing transit accessibility research:
- ☐ List all transit agencies operating in study area
- ☐ Verify GTFS data includes each agency
- ☐ Check stop counts against published agency statistics
- ☐ Use aggregated data sources (Cal-ITP, Transitland) when available
- ☐ Flag and investigate areas with suspiciously low stop density
- ☐ Document data sources, coverage, and known gaps
- ☐ Test sensitivity: how do results change with different data sources?
Data and Methods
Original analysis:
- GTFS feeds from 8 agencies: VTA, AC Transit, Muni SF, BART, LA Metro, SacRT, OCTA, San Diego MTS
- 24,421 transit stops
- Downloaded individually from agency websites
Corrected analysis:
- Cal-ITP GTFS Ingest Pipeline (data.ca.gov)
- 143,203 raw stops, 64,060 unique after deduplication
- Statewide coverage from 200+ agencies
Classification unchanged:
- Mobility desert = grocery within 1 mile, transit stop > 0.5 miles OR < 2 stops within 0.5 miles
- Same thresholds, same spatial calculations, same methodology
Notes
[1] Preliminary internal analysis conducted November 2025 using individually downloaded GTFS feeds from 8 California transit agencies. This result was not published due to validation concerns described in this article. ↩
[2] Corrected analysis using Cal-ITP statewide GTFS data, November 2025. Same methodology, different transit data source. ↩
[3] LA Metro operates approximately 2,200 buses serving over 5,000 stops across Los Angeles County. Source: LA Metro Facts at a Glance 2024. ↩
[4] Cal-ITP (California Integrated Travel Project) is a statewide initiative to standardize and aggregate transit data. GTFS feeds available at data.ca.gov. ↩
[5] Transitland (transit.land) aggregates GTFS feeds from transit agencies worldwide. The National Transit Database (ntdprogram.gov) provides agency-level statistics. ↩
Tags: #FoodSecurity #DataQuality #TransitData #GTFS #CalITP #Validation #Methods #Research
Next in this series: What county comparisons teach us about measurement—why the same metric produces wildly different results across jurisdictions.
How to Cite This Research
Too Early To Say. "The Data Quality Problem: How We Went From 49% to 12% Mobility Deserts." November 2025. https://tooearlytosay.com/research/food-security/data-quality-49-to-12/Copy citation