A Google Sheet became a paper's central contribution. I almost forgot it existed.
We were revising a paper on pandemic income shocks in California: how COVID-19 affected household income across labor markets, and whether safety net programs buffered the losses. The nominal income analysis told a reassuring story. Gaps between high-cost and low-cost areas narrowed during the pandemic. Low-income families in expensive metros like San Francisco gained ground relative to families in cheaper areas like Fresno.
Then came the intuition: "These families in expensive metros were probably still worse off in real terms."
That thought triggered a memory. Somewhere, years earlier, I had downloaded cost-of-living data from the Council for Community and Economic Research (C2ER). It sat in a Google Sheet, acquired for an entirely different project. It was absent from the analysis plan. It was absent from the editor's feedback. Simply forgotten.
Once found and integrated, the story reversed completely. Low-income families in San Francisco went from a $2,600 purchasing power advantage in 2019 to a $700 disadvantage by 2023. The finding that geographically uniform safety net benefits accidentally reversed fortunes across regions emerged entirely from auxiliary data we almost lost track of.
This raises an uncomfortable question: How much useful data sits dormant in our project folders, waiting for the right research question to make it relevant?
The Mismatch Problem
The C2ER incident reflects a systematic mismatch between how we organize research data and how we retrieve it. Let's look at this pattern more closely.
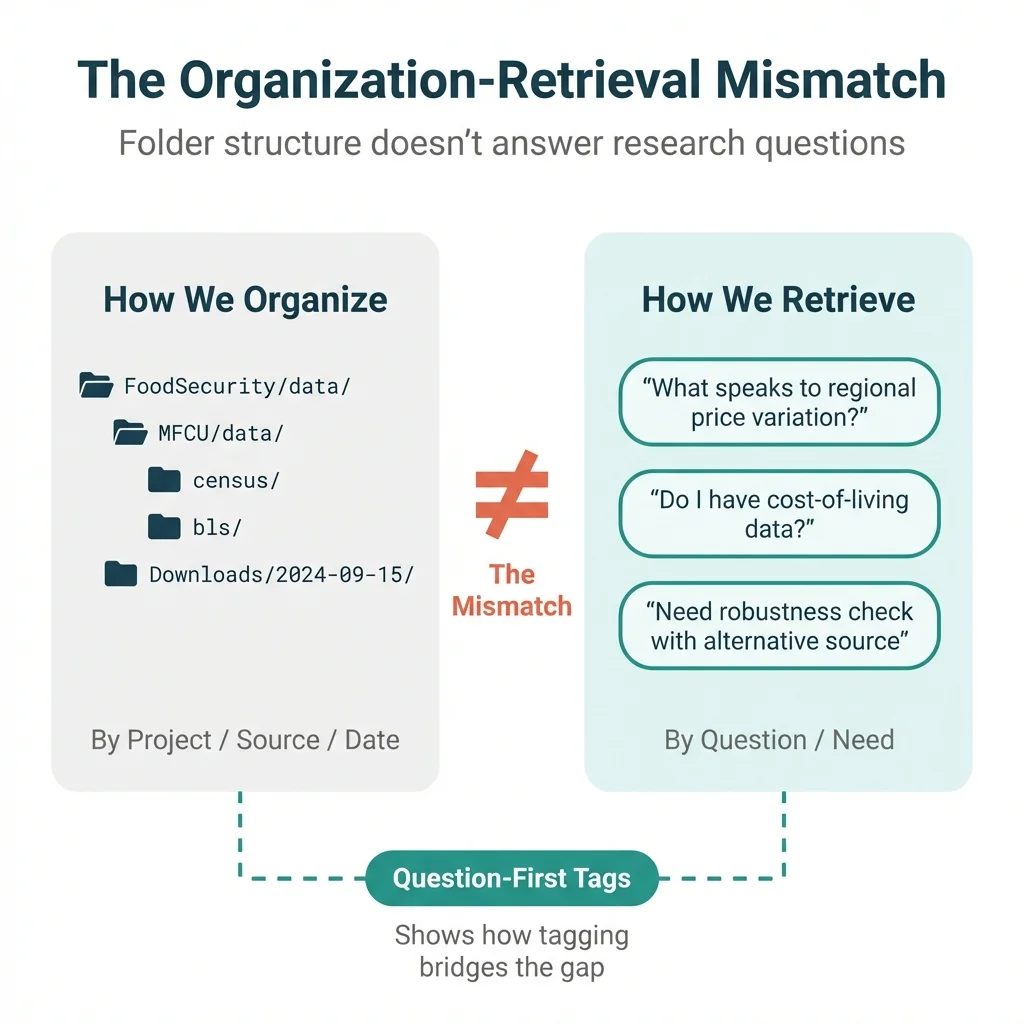
How we organize:
Think about where our data lives. We store it by project (FoodSecurity/data/, MFCU/data/), by source (census/, bls/, c2er/), or by date (downloads folder, timestamped files). These organizational schemes make sense when working on a specific project and needing to find specific files.
How we retrieve:
But when a new research question emerges, we search by need: "What speaks to regional price variation?" or "Do we have cost-of-living adjustments?" or "The reviewer wants a robustness check with alternative data."
The folder structure fails to answer these queries. The connection between "what we have" and "what we need" lives entirely in our heads.
Why data is harder than notes:
Consider the difference with notes. Notes contain natural language. If we wrote about cost of living in a research memo, we can grep for "cost of living" and find the passage. Datasets differ: they contain tables of numbers. We can't grep a CSV for "helps answer questions about purchasing power."
The meaning of the data exists as tacit knowledge. It lives nowhere except our memory. And memory proves unreliable.
The documentation gap:
Standard data documentation captures what data is: source, variables, geography, time period. This matters for reproducibility and for others who might use our data.
But standard documentation omits what questions the data could answer. It omits "this dataset can compare purchasing power across regions" or "this dataset can adjust nominal income to real income." That semantic layer, the bridge between data and research questions, remains undocumented.
The Insight: Question-First Tagging
The solution is simple in principle: tag data by the questions it can answer, not just by what it contains.
Consider the C2ER cost-of-living data. Standard metadata captures the basics:
dataset: c2er_cost_of_living
source: Council for Community and Economic Research
variables: [COMPOSITE_INDEX, HOUSING, GROCERIES, UTILITIES]
geography: California metropolitan areas
time_period: 2018-2023 (quarterly)
This is necessary but insufficient. It tells us what the data is, not what it can do.
Question-based tags add the missing layer:
questions_answerable:
  - "How does purchasing power vary across regions?"
  - "Are flat-dollar policy benefits worth the same everywhere?"
  - "What is the real (cost-adjusted) income in different metros?"
  - "How much more expensive is San Francisco than Fresno?"

constructs_measured:
  - cost of living
  - regional price parity
  - real vs nominal conversion

linkable_to:
  - ACS microdata (via metro area)
  - Any income data needing COL adjustment
See the difference? The second set of tags would have surfaced C2ER immediately when the question arose: "Are these families actually worse off in real terms?"
The schema: Four dimensions for retrieval
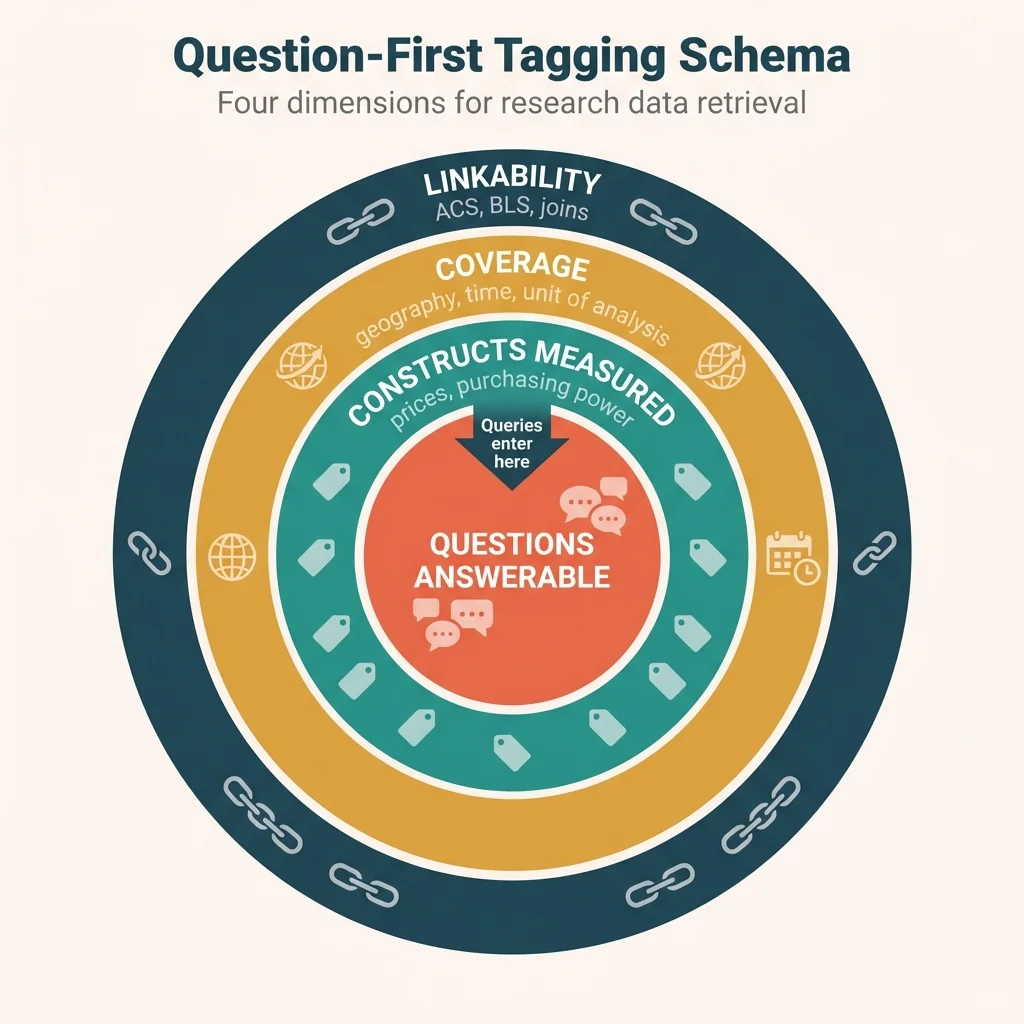
Here's a simple schema with four dimensions that support future retrieval:
| Dimension | What It Captures | Example |
|---|---|---|
| Questions Answerable | Research questions this data could help answer | "Real vs nominal income comparison" |
| Constructs Measured | Conceptual variables, not just column names | Prices, purchasing power, cost of living |
| Coverage | Geography, time, unit of analysis | CA metros, 2018-2023, quarterly |
| Linkability | What other datasets it joins with | ACS via metro, any income data |
The key shift: from "what is this data?" to "what can this data answer?"
When a new research question arises, we search for answers rather than data sources. Question-based tags align our storage patterns with our retrieval patterns.
Implementation: Data Cards
A data card is a brief document (YAML, Markdown, or JSON) that captures both standard metadata and question-based tags for each dataset we acquire.
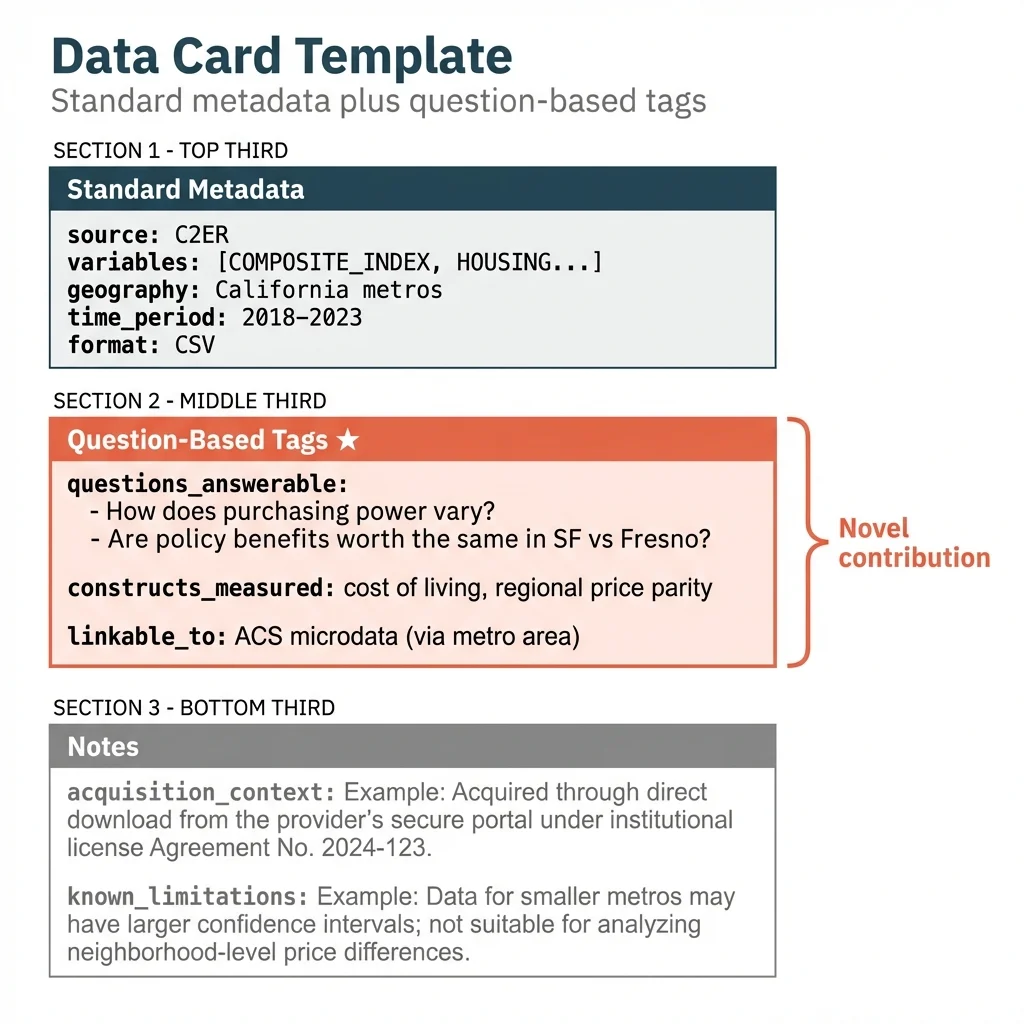
Here's the complete template, using C2ER as an example:
# Data Card: C2ER Cost of Living Index

## Standard Metadata
source: Council for Community and Economic Research
acquired_date: 2025-09-15
location: Google Sheets / FoodSecurity/data/c2er_cost_of_living.csv
format: CSV
variables: [COMPOSITE_INDEX, HOUSING, GROCERIES, UTILITIES, TRANSPORTATION]
geography: California metropolitan areas
time_period: 2018-2023 (quarterly)
unit_of_analysis: Metro area

## Question-Based Tags
questions_answerable:
  - "How does cost of living vary across California metros?"
  - "Can we convert nominal income to real purchasing power?"
  - "Are policy benefits worth the same in SF vs. Fresno?"
  - "How much higher are housing costs in coastal vs. inland areas?"

constructs_measured:
  - cost of living
  - regional price parity
  - housing affordability
  - real vs nominal income adjustment

linkable_to:
  - ACS microdata (join on metro area / CBSA)
  - BLS Regional Price Parities
  - Any household income dataset

potential_analyses:
  - Deflate nominal income to real income
  - Compare purchasing power across regions
  - Assess geographic equity of flat-dollar benefits

## Notes
acquisition_context: "Downloaded for MFCU wage competitiveness analysis"
known_limitations: "Some metros missing; imputation required"
A suggested workflow:
- On acquisition: Create a data card with standard metadata plus 3-5 question-based tags
- Claude enrichment: Ask Claude to suggest additional questions the data could answer
- Periodic review: Revisit cards when starting new projects
- Query on need: When a new research question arises, ask Claude to search the inventory
Where Claude fits:
Claude can help with both tag generation and inventory search:
- Generate question-based tags: Given variable names and data structure, Claude can infer "this dataset could help answer questions about..."
- Semantic matching: Given a new research question, Claude can search a tagged inventory for relevant datasets
- Surface non-obvious connections: Claude can find matches that keyword search would miss
What Claude can't do:
- Know what data we have unless we tell it
- Replace our judgment about what matters
- Automatically maintain the inventory
The system works through collaboration: We maintain inventory → Claude enriches tags → Claude queries on demand
What This Adds
Several practices already address data management, but each has a gap:
| Practice | Purpose | Gap |
|---|---|---|
| Data documentation | Describe what data IS | Omits what questions it answers |
| FAIR principles | Make data findable for others | Omits findability for our future selves |
| Personal knowledge management | Organize notes and ideas | Excludes datasets |
| Research data management | Archive and version data | Excludes semantic retrieval |
Most data management asks: "Can others use this?" or "Do we remember what this is?"
Question-first tagging asks a different question: "Will we find this when we need it for a question we haven't yet asked?"
The counterfactual:
Consider what would have happened with a data card for C2ER created when first downloading it, with question-based tags like "real vs nominal income" and "regional price comparison."
When the intuition arose during the JUE revision ("these families are probably still worse off in real terms"), we could have queried our inventory: "What speaks to real vs. nominal income?"
The C2ER card would have surfaced immediately. Instead of relying on a lucky memory, systematic retrieval would have done the work.
The broader pattern:
Researchers accumulate auxiliary datasets constantly. Census downloads for one project. BLS data for another. Conference presentation data. Replication package datasets. Most of this data sits unused after its initial purpose.
We almost certainly have useful data somewhere in our files. The question is whether we can find it when a new research question makes it relevant.
How to Start
Here's a concrete first step: tag our three most recent datasets.
- Pick the three most recent datasets we've acquired
- Create a data card for each with:
- Standard metadata (source, variables, coverage)
- 3-5 questions it could answer
- What other data it links to
- Store the cards in a searchable location (folder, notes app, Claude project context)
Claude prompt for tag generation:
Here's a dataset we have:
- Source: [source]
- Variables: [list]
- Geography: [coverage]
- Time period: [years]

What research questions could this data help answer?
What other datasets might it link with?
Suggest 5 question-based tags for our data inventory.
Claude prompt for inventory query:
We have a new research question: [question]

Here's our data inventory: [paste cards or reference file]

Which datasets might be relevant? Include non-obvious connections.
The payoff:
We move from "we forgot we had this" to "Claude, what do we have that speaks to X?"
Serendipity becomes systematic. The auxiliary data accumulated over years of research becomes a searchable inventory rather than a graveyard of forgotten downloads.
The C2ER data transformed a paper. The next dataset that transforms our work might already be sitting in a folder somewhere, waiting for the right question to surface it. Question-first tagging ensures we can find it.
This is a methodology post from Too Early to Say, exploring how applied economists can work more effectively in the age of AI.
How to Cite This Research
Cholette, V. (2026, January 16). The data we forgot we had: A tagging system for research serendipity. Too Early To Say. https://tooearlytosay.com/research/methodology/question-first-data-management/Copy citation