When Congress passed the Individuals with Disabilities Education Act, they promised to fund 40% of special education costs.1
They've never come close. The actual number hovers around 15%.
Somebody has to make up the difference.
| Fiscal Year | Federal IDEA Funding | Estimated Full Funding (40%) | Federal Share |
|---|---|---|---|
| 2010 | $11.5 billion | $29.0 billion | 15.8% |
| 2015 | $11.8 billion | $32.4 billion | 14.5% |
| 2020 | $13.0 billion | $36.2 billion | 14.3% |
| 2024 | $14.2 billion | $40.1 billion | 14.1% |
Federal IDEA Part B funding vs. 40% of estimated national excess costs for special education. Sources: U.S. Department of Education Budget History; AASA special education expenditure estimates.
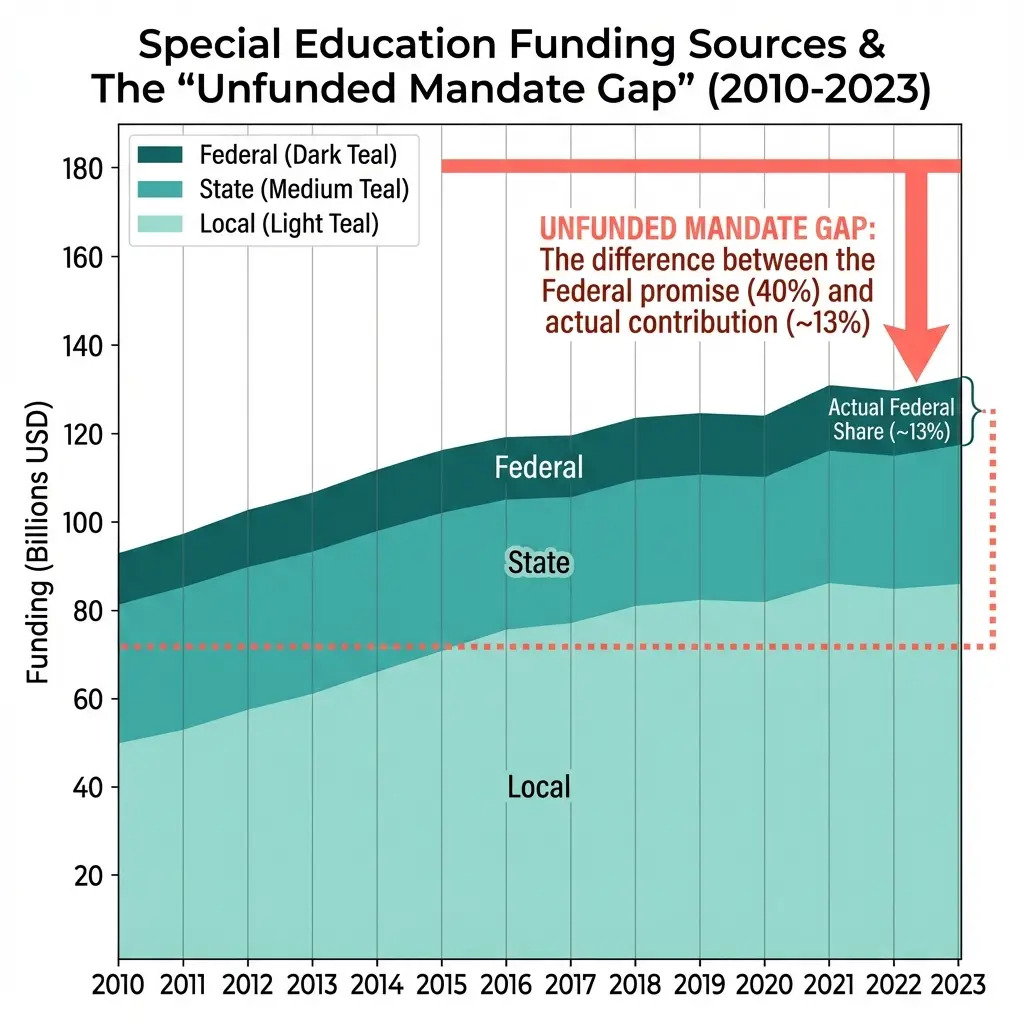
What This Shows
The promise was never kept. Federal funding has consistently remained at 14-16% of estimated special education costs, far below the 40% target established when IDEA was enacted.
The gap is growing. As special education costs rise faster than federal appropriations, the absolute dollar gap widens each year.
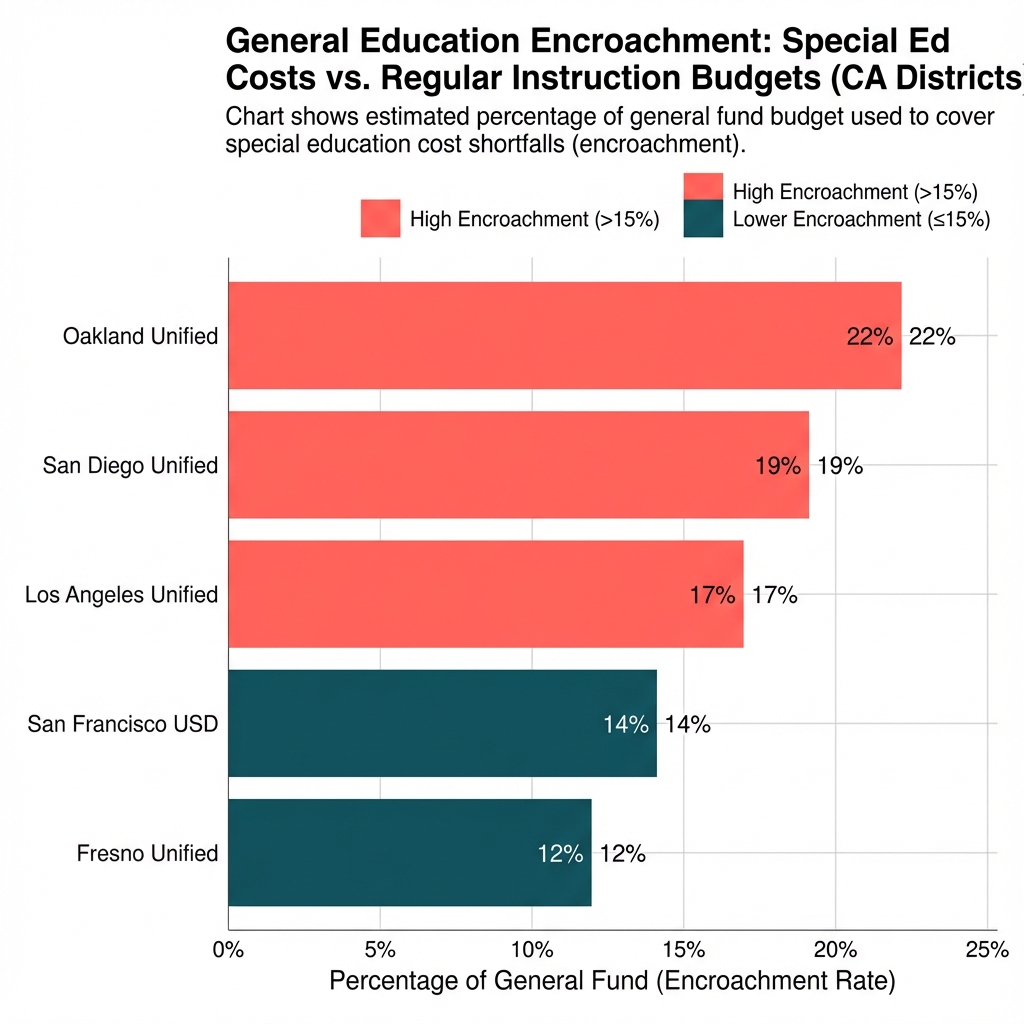
The Encroachment Problem
In education finance, we call it "encroachment." Special education costs exceed special education revenue, and the gap must be covered from general funds.2
In California, encroachment averages 3-4% of general fund budgets. But averages hide variation. Districts with high-cost placements can see encroachment consume 10% or more of general education resources.
| Encroachment Level | Share of Districts | Mean General Fund Impact |
|---|---|---|
| Low (<2%) | 28% | 1.2% |
| Moderate (2-5%) | 44% | 3.4% |
| High (5-10%) | 21% | 6.8% |
| Very High (>10%) | 7% | 13.2% |
Encroachment = (SpEd expenditures - SpEd revenue) / General fund expenditures. N = 958 California unified school districts, 2018-19. Source: California SACS financial data.
The Zero-Sum Reality
Every dollar of encroachment is a dollar not spent on general education students. That's concrete:
When special education costs rise and state/federal funding doesn't keep pace, general education shrinks:
- Larger class sizes
- Fewer counselors and librarians
- Eliminated electives
- Deferred purchases
The Uncomfortable Truth
IDEA's protections for students with disabilities remain in place. The debate isn't about removing them.
The question is about costs.
The federal government promised 40% funding. They deliver around 15%. The gap comes from somewhere. During budget constraints, this gap can grow as districts maintain special education while adjusting elsewhere.
Someone pays for special education. Understanding who helps us think clearly about policy.
Limitations
Self-reported impacts. The encroachment impact data comes from district administrator surveys, which may reflect perceptions rather than documented budget changes.
Causation unclear. Districts facing encroachment pressures may also face other fiscal challenges. We cannot isolate the specific effect of encroachment from general budget constraints.
Cross-state variation. California's special education funding formula differs from other states. Encroachment levels and impacts may vary considerably in other contexts.
Data and Methods
Data sources:
- Federal funding: U.S. Department of Education Budget History tables
- State/local funding: California SACS financial reports
- Encroachment calculations: (Special education expenditures - Special education revenue) / General fund expenditures
- Survey data: California Association of School Business Officials
Sample: 958 California unified school districts for encroachment calculations; 312 districts responding to CASBO survey for impact data.
Federal share calculation: IDEA Part B appropriations divided by estimated national excess costs (total special education expenditures minus base per-pupil costs).
Notes
1 Education for All Handicapped Children Act of 1975 (P.L. 94-142), later reauthorized as IDEA. The 40% federal funding target was established as the "full funding" goal, representing federal share of estimated excess costs for educating students with disabilities.
2 WestEd. (2020). California Special Education Funding System Study, Part 1: A Descriptive Analysis of Special Education Funding in California. California Department of Education. https://www.wested.org/resources/california-special-education-funding-system-study-part-1/
How to Cite This Research
Too Early To Say. "The Unfunded Mandate: How Federal Promises Shape School Budgets." December 2025. https://tooearlytosay.com/research/methodology/unfunded-mandate-special-education/Copy citation