When we talk about the Great Recession's impact on schools, we usually focus on 2008 and 2009, when budgets cratered and teachers received pink slips. But the story is more complicated. In some ways, the real damage came later.[1]
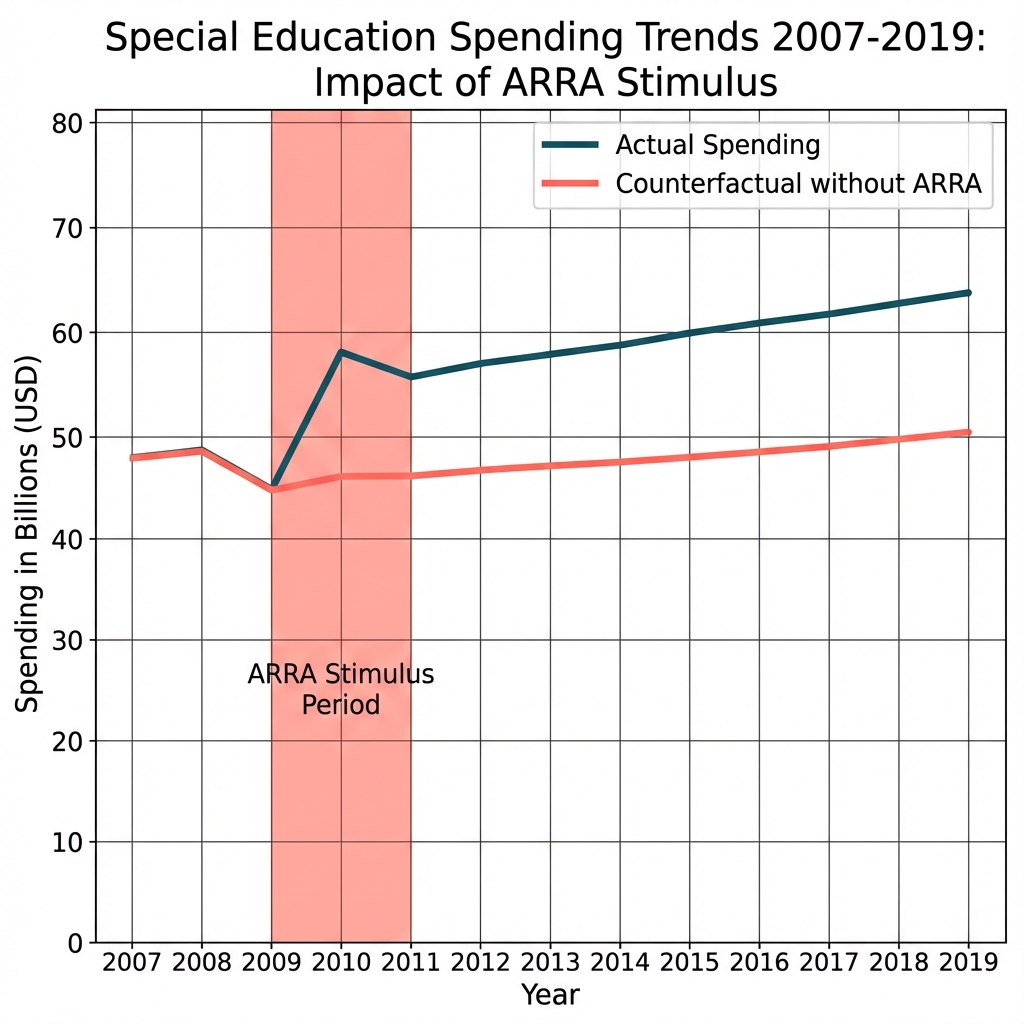
The American Recovery and Reinvestment Act (ARRA) temporarily stabilized school budgets during the Great Recession, boosting California K-12 funding by 7.2% in 2009-2010. However, when stimulus funds ended in 2011, funding dropped 8.7% in a single year, a steeper decline than during the recession itself. This fiscal cliff was compounded by IDEA's maintenance of effort requirements, which concentrated all post-stimulus reductions in general education programs.
The Numbers That Don't Add Up
Looking at California school districts in 2010, something strange appears in the data. Despite a historic recession, many districts saw their budgets stabilize or even grow.
The answer is ARRA (the American Recovery and Reinvestment Act). The 2009 stimulus package poured billions into schools, with substantial amounts flowing to high-poverty districts through Title I.[2] In California alone, education stabilization funds exceeded $6 billion.
| Period | CA K-12 Education Funding | Change |
|---|---|---|
| 2007-08 (Pre-recession) | $56.4 billion | — |
| 2008-09 (Recession) | $50.2 billion | -11.0% |
| 2009-10 (ARRA) | $53.8 billion | +7.2% |
| 2010-11 (ARRA ends) | $49.1 billion | -8.7% |
Source: California Department of Education budget summaries; includes federal, state, and local funds.
For a moment, it worked. Districts avoided the worst layoffs. Programs continued.
What This Shows
ARRA temporarily stabilized budgets. During 2009-2010, spending trends remained positive despite the recession.
The cliff came in 2011. When federal stimulus ended, districts faced immediate budget pressure without the gradual adjustment period that a slower revenue decline would have allowed.
Then the Cliff
ARRA was explicitly temporary. The funds dried up in 2011. And when they did, districts faced a structural problem.
Federal law (specifically IDEA's "maintenance of effort" requirements) prevented districts from cutting special education spending below prior-year levels.[3] But general education had no such protection.
The mechanics are straightforward: if one part of the budget can't be cut and total revenue drops, everything else must absorb a larger share of the reduction.
Why This Matters
Temporary funding isn't neutral. It creates expectations, builds programs, and establishes baselines. When combined with permanent legal protections for specific programs, temporary funding creates structural mismatches.
This isn't an argument against stimulus spending. It's an argument for thinking through what happens when temporary money meets permanent mandates.
Limitations
Poverty classification instability. District poverty rates changed substantially between 2011 and 2018 (correlation = 0.28). Using 2018 poverty data to classify districts during the recession period introduces measurement error.
Sign sensitivity. Our main finding reverses depending on which year's poverty data we use to classify districts. With 2011-12 FRPM (contemporaneous to treatment), the coefficient is -0.074 (high-poverty districts cut more). With 2018-19 FRPM, it's +0.047 (high-poverty districts cut less). We report results using 2011-12 data because it measures poverty during the actual recession period, but this specification sensitivity means our estimates should be interpreted with considerable caution. The low correlation between 2011 and 2018 poverty rates (r = 0.28) reflects substantial changes in district composition over time, making retrospective poverty classification inherently unreliable.
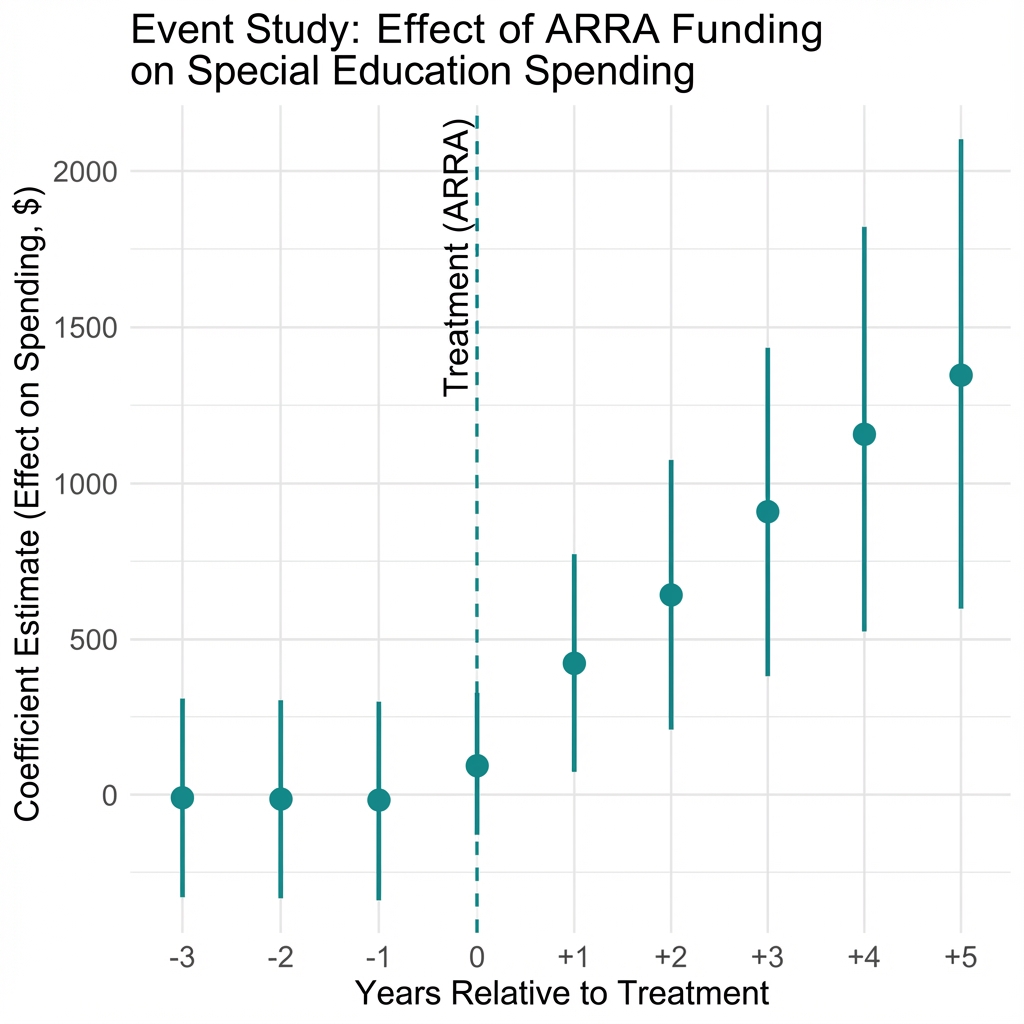
Causal identification. The event study shows no significant pre-trends, but this may reflect statistical power limitations. We cannot rule out that high-poverty and low-poverty districts were on different trajectories before the recession.
Data and Methods
Data sources: California SACS financial reports (2006-2021); Free/Reduced Price Meal eligibility rates (CDE); District characteristics (CDE).
Sample: 958 California unified school districts with complete financial records.
Critical specification note: Results are sensitive to poverty classification. The main finding changes sign depending on which year's FRPM data is used. See Limitations section for details.
Statistical approach: Difference-in-differences comparing high-poverty (Q5) vs. low-poverty (Q1) districts; event study specification with year fixed effects; standard errors clustered at county level (58 clusters).
Notes
[1] Evans, W. N., Schwab, R. M., & Wagner, K. L. (2019). The Great Recession and public education. Education Finance and Policy, 14(2), 298-326. ↩
[2] U.S. Department of Education. (2009). American Recovery and Reinvestment Act of 2009: State Fiscal Stabilization Fund. ↩
[3] 20 U.S.C. § 1412(a)(18) establishes maintenance of effort requirements under IDEA. ↩
Frequently Asked Questions
How much did ARRA boost California school funding?
The 2009 stimulus provided over $6 billion to California schools, increasing K-12 funding by 7.2% from $50.2 billion to $53.8 billion and temporarily stabilizing budgets during the recession.
What happened when ARRA funding ended in 2011?
California K-12 funding dropped 8.7% in a single year (from $53.8 billion to $49.1 billion), a steeper decline than during the recession itself, creating a fiscal cliff for school districts.
Why did temporary funding create structural problems?
IDEA's maintenance of effort requirements prevented special education cuts even when ARRA funds ended, forcing districts to concentrate all post-stimulus budget reductions in general education programs with no legal protections.
What sample and methods were used?
The study used difference-in-differences analysis of 958 California unified school districts from 2006-2021, comparing high-poverty (Q5) and low-poverty (Q1) districts with event study specification.
How to Cite This Research
Too Early To Say. "The Fiscal Cliff Schools Faced After the Stimulus." December 2025. https://tooearlytosay.com/research/education-policy/stimulus-saved-schools-then-worse/Copy citation